ACTLA Presentation – Loss of Income for Self-Employed Plaintiffs

Derek Aldridge, Economica

derek@economica.ca

(I consent to redistribution of this unmodified document)

ACTLA Presentation – Lunch and Learn

March 25, 2021

Loss of income for self-employed plaintiffs

I will briefly discuss the approach that I use to estimate the loss of income for self-employed plaintiffs. Simply determining the true income of a self-employed worker can be challenging, and I will address some of these challenges. I will also discuss some approaches that can be used to estimate their loss of income.

Note that my tables and charts are based on actual cases I have worked on, but I have made various adjustments to simplify the presentation to preserve confidentiality.

Estimating the income of a self-employed worker

Determining the income of a self-employed worker can be much more complicated than for a regular employee.

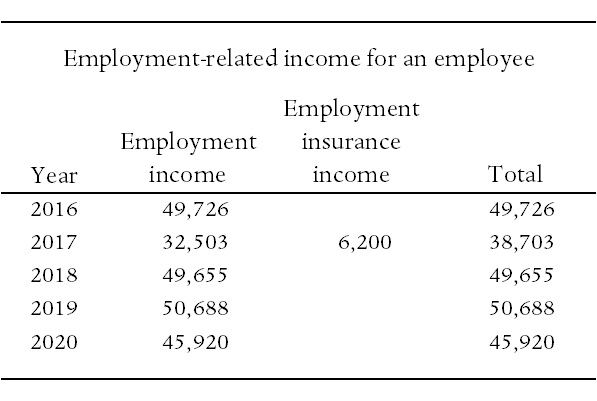
For a plaintiff who is an employee and not self-employed, their income is simply the amount they are paid by their employer. Employment insurance income is also relevant for our calculations. Both of these sources of income are usually easy to determine by looking at the plaintiff’s income tax records. An employee might have income tax records that look something like this:

Usually, the income tax records will give us an accurate description of the income of an employee-plaintiff – at least for the pre- accident period. After the accident there can be income replacement benefits that do not appear in the income tax records.

For a self-employed worker, their personal income tax records usually only tell us part of the story of their income. The personal income tax records for a self-employed plaintiff might look something like this:

For the self-employed worker, the income reported on their personal tax returns will often not reflect their true income in each year. I will discuss this below.

For my purposes, there are two categories of self-employed workers: those who operate their business as a sole proprietorship, and those who operate a corporation.

Sole proprietorship

  • These are usually fairly straightforward.
  • All business income appears on the personal income tax returns – usually as gross and net business income.
  • There is a statement of earnings with the personal tax return that shows a detailed description of revenue and expenses.
  • All business income is paid to the business owner each year. There is no separate corporation where profit can be held separately from the owner. Because there is not a separate corporation, most of the information we need to estimate the plaintiff’s income is usually contained in their personal tax records.

Corporation

  • These are more complicated, and I will focus my discussion on cases when the plaintiff’s business is a corporation.
  • The plaintiff operates his business through a numbered or named corporation (for example, 1234567 Alberta Ltd, or Derek Aldridge Consulting Ltd). The corporation is a separate entity from the plaintiff, so income earned through the corporation will not necessarily appear on the plaintiff’s personal income tax records. That is why we need the corporate financial statements.
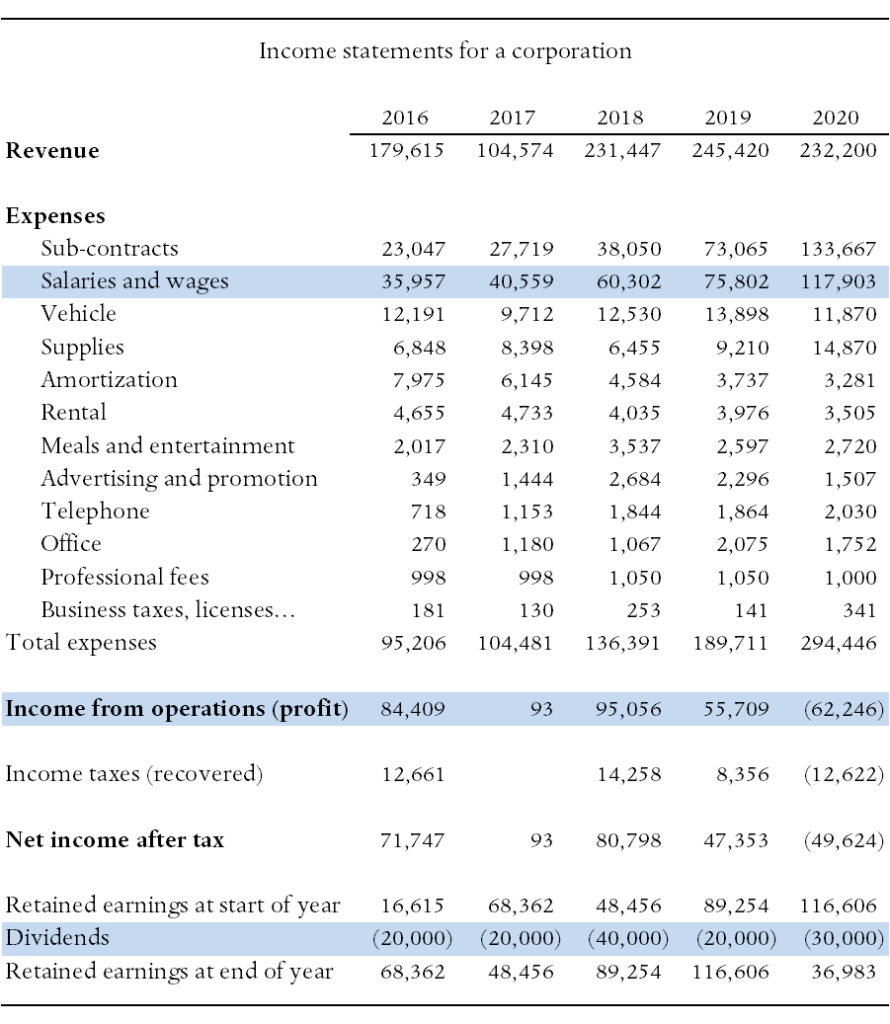
  • The business income statements show the revenue and expenses for each year. When I combine the income statements for several years, I create a table that looks something like this:

The income statements can get quite complicated, but in general, we see the revenue at the top, which is the income the business earned each year. Then we have various categories of expenses. The business owner usually pays himself a salary, and it is included here as an expense, because his salary is an expense to the business. The salary for other workers at the business is also likely included in that same expense category. The revenue less the expenses gives us the income from operations (profit), before accounting for corporate taxes. In principle, the business owner could pay himself a high enough salary so zero profit would remain. But usually what happens is some of the profit is left in the business as retained earnings, which is effectively savings (the corporation does not need to pay out all profit to the owner every year). The business financial records will show us how these retained earnings have accumulated over time, and will also show us when the owner draws down these savings by taking dividends.

When examining the corporate income statements, I am most interested in how much the business paid the owner in salary (part of the business expenses), and how much before-tax profit the business had after expenses, since that profit effectively belongs to the owner and could have been paid to him as part of his salary. The business owner’s income is the total of the salary (employment income) that the business paid him, plus the profit that the business earned. The salary is reported on his personal tax return, but the business profit is not. The owner might also report dividend income from the corporation, but I do not normally count this as part of his income. Because I am attributing all of the business profit to the owner in each year, this captures all of the dividend income that could be paid in future years.

Note that dividend income can cause some confusion because it does not necessarily reflect earnings from the year under consideration. If the business has accumulated significant retained earnings from previous years’ profits, the owner could still pay himself a large dividend in a year when business was poor.

Below I compare the income reported on this business owner’s personal income tax records with his true income:

We see that there can be quite a large difference between the business owner’s true income and the income that is reported on his personal income tax records. Another potential complication is that the corporation reports its income in a fiscal year, which may be different from a normal calendar year. So if fiscal 2019 for the corporation is the 12-month period from August 2018 through July 2019, it will make it more difficult to match up income reported on the personal tax returns with the corporate financial statements.

Documents and information required

Below I list some of the documents and information that I like to have when dealing with a self-employed plaintiff.

  • The business income statements show the revenue and expenses for each year.
  • The balance sheet is usually included with the income statement as part of the annual financial statements that are usually prepared by an accountant. However, there is usually not much useful for me in the balance sheet.
  • I need the plaintiff’s personal income tax records because they will show the salary (employment income) that he drew from the business.
  • Sometimes the business pays a salary to another family member. Perhaps the owner’s wife does bookkeeping and the business pays her a salary of $20,000 per year. That’s fine, but if she is being overpaid for this work (income-splitting) then I should account for this. For example, if she is being paid $20,000 but an arms-length bookkeeper would only be paid $12,000, then that extra $8,000 actually reflects the plaintiff’s income.

Approaches to determine a loss of income

Once we have a good estimate of the plaintiff’s true income in every year, the next step is to try to estimate his loss of income in each past year, and in the future. While I am focusing on cases when the plaintiff owns and operates a corporation, many of the same principles apply for sole-proprietorship cases.

One of the first things to consider is what is being claimed was the impact of the accident on the business income? This might look obvious from the financial records (for example, a sharp decline in revenue in the years following the accident), but there could be many other effects.

If business revenue declined following the accident, why was that? Is it because the plaintiff missed a few months of work? Is it because she reduced her work hours? Is it because she was less productive during the hours that she worked? Did she target jobs that were less physically demanding and less lucrative? Did she miss out on certain high-value contracts? In my view, answering these questions can be an important part of the narrative. There can be many reasons for a decline in revenue that are unrelated to an injury, so we want to know what is the reason for the revenue decline that we have observed.

Note that it could be the case that business revenue did not decline, but if the accident had not occurred, revenue would have been higher. That is, revenue might have been stable or increasing after the accident, but still less than it would have been absent the accident.

Sometimes business expenses increase because of the accident. This could happen if a worker or a subcontractor was hired to take on some of the duties that the plaintiff normally would have performed. This should also be accounted for in my calculations.

In some cases we can simply compare the plaintiff’s total business income in the years before the accident with her income after, and estimate a loss on that basis. However, because of the many factors that can influence business income, it is often preferrable to try to account for the specific impacts that the plaintiff’s injures had on her business revenue and expenses.

In one case, I had a self-employed worker who had a fairly straightforward business and she billed her services to several clients at an hourly rate. The claim was that because of her injuries, she was reduced in her ability to work and bill hours. Billing more hours would not have led to significant increased expenses. Fortunately, she had detailed records showing her billing and the pattern confirmed her claim:

As shown above, it appears that this plaintiff’s billed hours declined greatly following the accident. They have improved somewhat, but she continues to bill less than she did before the accident.

In this case I was able to estimate a loss of income by assuming that if the accident had not occurred, the plaintiff would have continued to bill her average monthly hours from before the accident, whereas with-accident, she will continue with her reduced billable hours. For the future calculations I can also include scenarios in which I assume that her billable hours will decline further (her condition declines), or that her billable hours will increase (her condition improves).

By examining the billable hours (instead of billings), this helps us account for revenue increases that are due to increases in the plaintiff’s hourly rate, versus increases due to billing more hours. For example, if the plaintiff has increased her hourly rate by 20 percent in the years following the accident, this could easily mask the revenue-effect of her average monthly hours having declined by 20 percent.

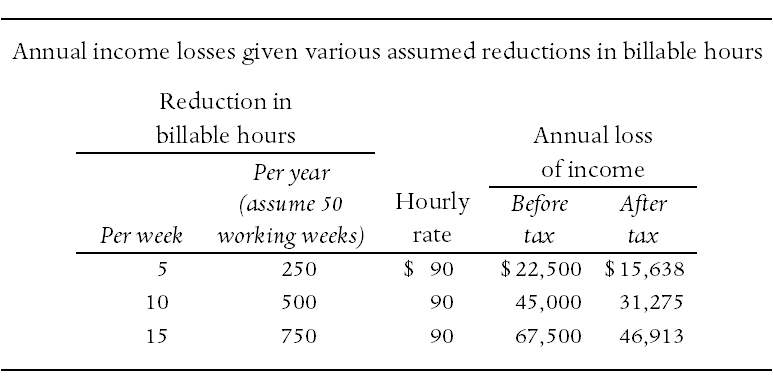
In another case that I worked on, the plaintiff was self-employed in a personal-services business and she charged an hourly rate for her services. It appeared that her total billable hours had decreased due to her injuries, and my client wanted me to simply provide a range of scenarios regarding the loss of income that would result from various reductions in billable hours. In the table below I show the potential annual loss that resulted from assumptions that her billable hours have been reduced by 5, 10, or 15 per week.

A case in which a plaintiff bills her services hourly, has no employees, and expenses that are mostly fixed (not increasing with additional billable hours), is almost an ideal scenario for estimating the loss. Her loss of income is directly linked to her ability to bill hours. Other cases can be much more complicated.

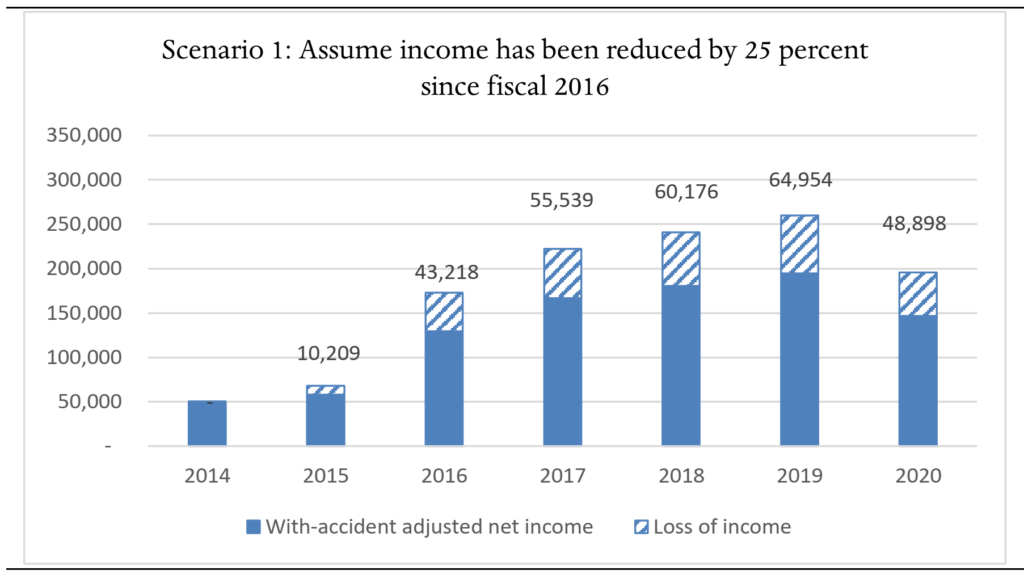
Another case that I worked on involved a plaintiff who was in the early stages of establishing his business when he was injured. Following the accident he was able to continue to grow his business, and his income increased accordingly. His business income was fairly complicated, with employees who also generated revenue, as well as numerous expenses. After estimating the income that he earned from his business, the potential loss of income was not at all obvious because his income had increased so much after the injury, as shown below.

Because the plaintiff was injured while he was in the early stages of establishing his business, I didn’t have a useful pre-accident history as a comparison. However, his business income was heavily linked to his ability to spend time at work, and to be productive during that time. Because of his injuries, it was claimed that he needed more many breaks at work and he was not able to perform some of the more lucrative jobs that would normally have been available to him. Effectively, the evidence was suggesting that if he was uninjured, his revenue and earnings would be much greater. The question of course, is how much greater? Ultimately I provided a range of scenarios, and one was that I assumed that his income has been reduced by 25 percent because of his residual deficits. (That is, he has only been earning 75 percent as much as he would have been earning if uninjured.) This is depicted in the chart below.

Clearly this is not as exact as we might hope, but providing a range of scenarios using this approach can at least provide an estimate of the loss if the Court accepts a certain set of assumptions. Dealing with a self-employed plaintiff can involve much more uncertainty than when we have (say) a teacher who is working three-quarters of full-time because of her injuries, rather than full-time.

Another approach that can potentially be useful is the replacement cost approach. In some cases it is possible for the plaintiff to hire a helper that will enable the business to continue as it would have in the absence of the accident, though with additional expenses (and reduced profit) due to the cost of the replacement worker. For example, an injured owner of a landscaping business might be able to hire a part-time labourer to assist him with some of the heavier tasks. If this helper is paid $40,000 per year, then business expenses will increase by $40,000 and profit will decrease by $40,000. That’s $40,000 that is not available to be paid to the owner, so his annual loss of income due to hiring the replacement worker would be $40,000 (not accounting for tax). In this case I am assuming that the self-employed landscaper can continue with the managerial aspects of his business, and he can perform some of the manual labour, but his residual deficits are preventing him from performing the heavier tasks.

The possibility of hiring a replacement worker is something that should especially be considered when the plaintiff is claiming that his income loss is particularly high. If the self-employed landscaper in my example above is claiming a huge annual loss, it is reasonable to ask why his loss is not capped at around the cost of a full-time labourer. But in other cases, the cost of hiring an assistant is not going to be a reasonable approach. For example, a surgeon with a back injury presumably cannot mitigate her losses by hiring a helper – her best option might be to take longer breaks in between procedures.

*   *   *

For a PDF version of this presentation, click here.

Summer 2019 issue of the Expert Witness newsletter (volume 23, issue 1)

Contents:

In this issue of The Expert Witness, we present two articles:

From the Desk of Christopher Bruce: Farewell

Christopher Bruce publishes his final Expert Witness newsletter. In this article, Chris writes about his achievements and the founding of Economica.

Selecting the Productivity Factor

In this article, the economists discuss the real rate of growth earnings, methods of predicting the real rate of growth earnings, and how to select a forecast.

We would also like to share; A Word from the Consultants of Economica.

A Pdf. version of the Newsletter can be found here.

A Word from the Consultants of Economica

We would like to say thank you to Dr. Christopher Bruce. You have been a great mentor for us throughout our careers with Economica. You have provided direction, leadership, advice, and have groomed us to be one of the leading firms in the industry. Your knowledge, guidance, and support throughout the years have been a major contributor to our success, and we truly appreciate everything we have learned from you.

We are thankful for the opportunity you have given us, and we will strive to maintain the level of professionalism, integrity, and service that Economica is known for, and continue to be one of the leading firms in this industry.

Thank you and enjoy your retirement Chris.


Selecting the Productivity Factor

One of the most important determinants of the plaintiff’s future earnings is the rate at which those earnings will grow. There are two broad determinants of this rate. First, each individual benefits from increases that arise from gains in experience, promotions, and job changes. Second, as the economy grows, the earnings of all individuals rise with it – the source of the popular aphorism “a rising tide lifts all boats.” The purpose of this article is to summarise the most recent research concerning the latter rate, which economists call the real rate of growth of earnings, and which the courts often refer to as the productivity factor.

We divide our discussion into three parts: In the first, we define what we mean by real rate of growth of earnings. In the second, we provide two types of statistical evidence concerning that rate. Finally, we argue that the most reliable projections of that rate are obtained from agencies that specialise in making such projections. We conclude that those projections indicate that real earnings will grow at approximately 1.25 to 1.50 percent per year in the long run.

1. Definition: Real rate of growth of earnings

Assume that it has been observed that economy-wide earnings have increased at five percent per year. This “observed” rate is referred to as the nominal rate of growth of earnings. Economists divide this rate into two factors: those due to increases in the average level of prices, the rate of price inflation, and those due to increases in the purchasing power of wages, the real rate of growth of earnings.

For example, if the rate of price inflation has been two percent per year, the first two percent of a five percent nominal increase will be needed just to allow individuals to buy the same set of goods that they had been able to purchase before the price increase. The remaining approximately three percent will be available to purchase additional goods. That three percent is called the real rate of growth of earnings.

As there is a strong consensus in the financial community that the long-run rate of price inflation will be approximately two percent, the forecast of wage growth can focus on the real rate of growth. [The financial community widely believes that the rate of inflation will be two percent because (a) that is the rate that the Bank of Canada has targeted since 1996; and (b) the Bank has managed to maintain the actual rate of inflation near its target since the latter was introduced.]


2. Methods of predicting the real rate of growth of earnings

In the long run, if workers are to be able to purchase more goods with their earnings (that is, if real wages are to rise), they must produce more goods. Hence, it is commonly argued that long-run increases in average real earnings must approximate long-run increases in average output per worker. As the latter is often called the rate of growth of productivity, the terms “real rate of growth of earnings” and “rate of growth of productivity” are often used interchangeably in the courts. Although this conflation could be misleading in the short run, when deviations between the two are common, if we are concerned with lifetime changes in a plaintiff’s earnings, projections of productivity growth can substitute for projections of real wage growth.

In this section, we provide two types of data concerning the growth of both real earnings and productivity. In the first, projections assume that past growth rates will continue into the future. In the second, models of the growth of the economy are used to derive predictions concerning growth of wages and productivity.

2.1 Historical data

In Table 1, we compare Alberta wage and price inflation, from 2001/2002 through 2017/2018. It is seen from this table that over the 2012-2018 time frame, which coincided with a considerable economic downturn in the Alberta economy (2014-2016), price inflation was higher than wage inflation. However, a longer-term perspective finds that wage inflation averaged approximately 0.78 percent higher than price inflation over the ten-year period 2008-2018; and approximately 1.0 percent higher than price inflation over the seventeen-year period 2001-2018.


If it is assumed that the experience of the last two decades or so is indicative of what will happen in the next few decades, then the data in Table 1 suggest that the real rate of growth of wages will be approximately 1.0 percent per year.

The data reported in Table 2, obtained from Statistics Canada, suggest that Canadian labour productivity has increased at an average annual rate of approximately 1.23 percent over the past 37 years (from 1982 through 2018), and 0.88 percent over the last five years (2014-2018).

Again, a forecast of 1.0 to 1.25 percent seems to be supported by the data.


2.2 Forecasting Agencies

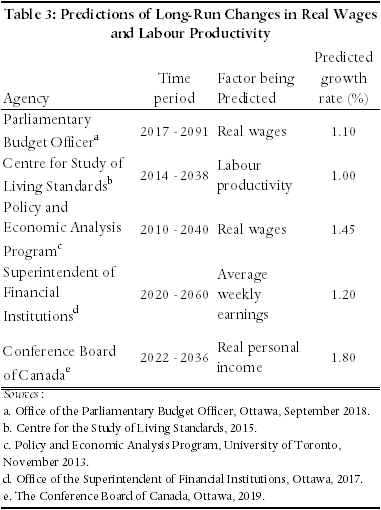
We have identified five reputable, independent agencies that provide public projections of either real wages or labour productivity. We summarise their long-run projections in Table 3, below.

Table 3 suggests that reputable forecasting agencies are predicting that real wages will grow at approximately 1.25 to 1.50 percent per year over the next two or three decades.

3. Selecting a forecast

Our experience is that most financial experts have relied on historical figures, such as those we reported in Tables 1 and 2, to project the rate of growth of real wages/productivity. For two reasons, we caution against acceptance of this approach.

First, there is no theoretical basis for assuming that what has happened in the past will continue into the future. For example, advances in computer technology are introducing changes to the economy that may differ in significant ways from those that have occurred in the past; the wave of “baby boomers” is about to retire from the labour force; and interest rates have fallen to historical lows.

Second, with very few exceptions, the financial experts who testify in personal injury cases have not devoted significant amounts of time to the analysis of long-run changes in labour productivity. Given a choice between the testimony of individuals whose primary expertise is in the preparation of personal injury reports and that of individuals who devote their professional lives to the forecasting of long-term trends in the economy, it seems to us clear that it is the latter that should be preferred.

Accordingly, we recommend that the courts rely on the forecasts of the five agencies identified in Table 3, and on others with similar expertise, when determining the “productivity factor” to be employed in personal injury and fatal accident actions.


The Impact of a Mid-Career Change on Earnings

by Derek Aldridge and Christopher J. Bruce 

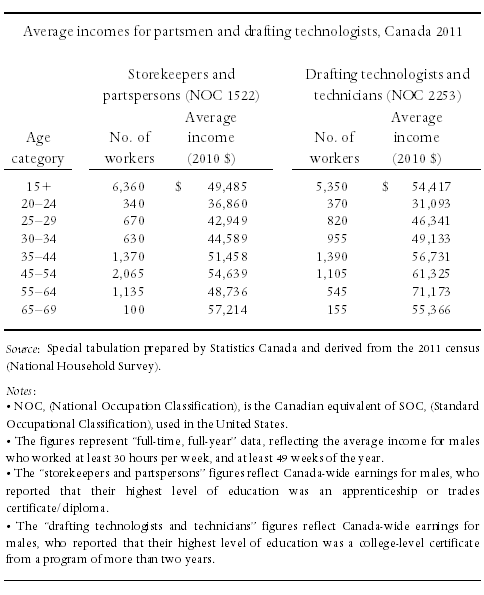
Vocational psychologists often recommend that injured plaintiffs retrain for a new occupation. An important question that arises in this situation is whether plaintiffs will start that occupation at an “entry-level” income (say the income of a 25 year-old) or at the income of an individual of the plaintiff’s calendar age. The importance of this issue can be seen in Table 1, which reports that, in two occupations that are commonly recommended as retraining possibilities – partsman and drafting technologist/technician – incomes for middle-aged workers can be 50 to 100 percent higher than those for 20-24 year-olds.

If it has been recommended that, say, a 40 year-old male retrain to enter one of these occupations, the economic expert is faced with determining which of the income levels from Table 1 best represents the income at which the plaintiff will begin his new career. If experience in the occupation, or movement along a career ladder, are important determinants of income, then we would expect that the plaintiff would begin at one of the lower incomes suggested by the census data. Perhaps with his greater maturity the 40 year-old would not start at the income level of a 20-25 year-old; but with no experience in this occupation, it seems unlikely that he would start at the income of a 40 year-old.

Fortunately, a number of empirical studies that provide information concerning this issue have been published in economics journals recently. We summarise the results of these studies here, to provide assistance both to vocational experts, who may not be familiar with the economics literature, and to economists, who may have been asked to calculate a loss in a case in which no vocational expert has provided a relevant opinion.

In the earliest of these studies, Goldsmith and Veum (2002) used a detailed survey that followed 1400 young workers from 1979 to 1996 to compare the effects of additional years of experience on wages when individuals: remained in the same occupation and industry, remained in the same occupation but moved between industries, remained in the same industry but changed occupations, and changed both occupations and industries. What they found was that the value that was placed on previous experience was approximately the same for all individuals except those that had changed both occupation and industry. In their words:

…experience acquired while a real estate agent is valued similarly as tenure at other occupations, such as accounting, within the real estate industry. In addition, the experience as a real estate agent is valued similarly to tenure at other industries, such as the pharmaceutical industry, if continuing in the occupation of sales. If the real estate agent becomes an accountant in the pharmaceutical industry, however, the experience as a real estate agent is of less value than that within accounting or the pharmaceutical industry.

(p. 442)


Referring to the examples in Table 1, Goldsmith and Veum’s findings suggest that the 40 year-old who retrains as a partsman may be able to earn an income comparable to that of a 40 year-old partsman with 15 years experience, if the retrained individual remains within his previous industry. For example, if an individual who had previously worked on oil rigs becomes a partsman in a shop that provides equipment to oil rigs, he might be expected to obtain a starting salary much higher than he would have obtained if he had become a partsman in an automobile dealership.

Subsequently, however, a number of studies cast doubt on Goldsmith and Veum’s findings. Both Zangelidis (2008), and Kambourov and Manovskii (2009) found evidence to suggest that occupation is much more important than industry. Zangelidis concluded, for example, that “[o]ccupational experience is expected to make an important contribution in determining wages…[whereas the] evidence on industry specificity… is not very supportive.” (p.439) And Kambourov and Manovskii (2009) concluded that “[job] tenure in an industry has a very small impact on wages once the effect of occupational experience is accounted for.”(p. 64)

The findings from these two studies suggest that if the plaintiff has not yet started a new post-accident job (and, hence, the wage at that job is not known), it may be appropriate to assume that she will begin that new job at an “entry-level” wage if she has re-trained for a new occupation (regardless of whether she remains in the same industry she was employed in before the accident); and will begin at a wage commensurate with others of her calendar age only if she has not changed occupations.

Hence, contrary to Goldsmith and Veum’s findings, these studies suggest that the 45-year old welder who retrains as a partsman will begin her new career at the earnings of a partsman at the start of her career.

Finally, two recent studies have asked whether the impact of retraining is a function of the worker’s initial occupation. For example: will craftsmen suffer a greater income loss if they are forced to change occupations than will salespeople? Sullivan (2010), using detailed information from the National Longitudinal Survey of Youth (NLSY), found that changes of occupation and industry each had significant negative effects on the earnings of professional workers and clerical workers; that changes in occupation, but not industry, had negative effects on craftsmen and service workers; and that changes in industry, but not occupation, had negative effects on managers, salespeople, and laborers.

All of these studies imply that the reduction in earnings is likely to be greater, the greater is the difference between the tasks performed in the worker’s previous job and those in his or her new job – especially if the individual had initially been in a high-skill occupation, such as a professional or craftsman. As a first approximation, therefore, the empirical literature suggests using the earnings of individuals in entry-level jobs when estimating the starting income of an individual who has been forced to retrain, regardless of that individual’s calendar age. Of course, this recommendation will have to be modified when information specific to the plaintiff is found to be inconsistent with the statistical data presented here.

References

Gathmann, Christina, and Uta Schonberg.

“How General is Human Capital? A Task-Based Approach.”  Journal of Labor Economics 28 (1) (2010) : 1-49.

Goldsmith, Arthur, and Jonathan Veum. “Wages and the Composition of Experience.” Southern Economic Journal 69(2), (2002): 429-443.

Kambourov, Gueorgui, and Iourii Manovskii. “Occupational Specificity of Human Capital.”  International Economic Review 50 (1) (2009): 63-115.

Sullivan, Paul.  “Empirical Evidence on Occupation and Industry Specific Human Capital.” Labor Economics 17 (2010): 567-580.

Zangelidis, Alexandros.  “Occupational and Industry Specificity of Human Capital in the British Labour Market.” Scottish Journal of Political Economy 55(4) (2008): 420-443

A version of this article was published in the Journal of Legal Economics, 24(1-2), September, 37-41.

leaf

Christopher Bruce is the President of Economica; he has a PhD in economics from  the University of Cambridge

Derek Aldridge has been a consultant with Economica since 1995 and has a master of arts degree in economics from the University of Victoria.


Selecting the Discount Rate (2017)

by Christopher J. Bruce, Derek W. Aldridge, Kelly Rathje, Laura Weir

When calculating the lump sum award that is to replace a stream of losses in the future, it is first necessary to determine the rate of interest, or discount rate, at which the award will be invested. In Canada, this rate is set equal to the real rate of interest, that is, to the nominal (or “observed”) interest rate net of the rate of inflation.1

Whereas most provinces mandate the discount rate that is to be used when calculating the present value of future losses, Alberta has left the determination of that rate to the courts. Accordingly, the testimony of financial experts on this matter has become an important element of most personal injury actions.

Over the last forty years, Economica has made important contributions to the debate concerning the choice of a discount rate. These contributions have come in the form of chapters in our textbook, Assessment of Personal Injury Damages (now in its fifth edition), articles in this newsletter, and submissions to reviews of the mandated rates in Ontario, Saskatchewan, and British Columbia.

In this article, we argue that whereas virtually all financial experts (including ourselves) have implicitly applied what we will call here the active management approach to the determination of the discount rate, it can be argued that an alternative technique, which we will call the annuity approach, is often more appropriate.

In Section I of this article, we describe these two approaches and investigate their relative merits. In Section II, we employ the principles developed in the first section, to examine how numerical measures of the discount rate might be obtained when discounting two types of future costs: medical expenses and losses of earnings. Finally, in Section III, we summarise our findings.

In that Section, we argue that:

  • if the plaintiff chooses to self-manage the investment of his or her award, the appropriate discount rate (net of inflation) is 2.5 percent; whereas
  • if the plaintiff chooses to purchase a life annuity, or have the defendant purchase a structured settlement, the appropriate discount rate (net of inflation) is zero percent. We argue that it is to the advantage of plaintiffs to make this choice in most cases in which their losses are expected to continue into ages of high mortality (usually after age 75 or so).

I. Two Approaches to Selecting the Discount Rate

There are two broad approaches to the determination of the discount rate, the annuity approach and the active management approach. In the former, it is assumed that plaintiffs will use their lump sum awards to purchase annuities. In the latter, it is assumed that they will invest their awards in a portfolio of stocks, bonds, mutual funds, and other financial assets.

In this section, we define the two approaches and investigate their relative merits. We conclude by identifying the circumstances in which each approach might be preferred to the other.

1. The Two Approaches Defined

The Annuity Approach

If the plaintiff has been awarded a lump sum award to replace a stream of losses from the date of trial until some specified termination date – most often the plaintiff’s projected date of retirement or date of death – he or she will be able to replace the future losses by purchasing an annuity, usually from a life insurance company. This purchase can take the form of either a life annuity or, under the auspices of the court, a structured settlement. In either case, the plaintiff will receive a specified stream of benefits until the termination date.

The purchase price of the annuity will be determined by three main factors: the value of the annual payments, the number of years to the termination date (which will, in part, be determined by the life expectancy of the plaintiff), and the rate of interest at which the insurance company is able to invest the funds received from the plaintiff (or defendant, in the case of a structured settlement).

It is this rate of interest that is known as the discount rate. In the case of an annuity, the discount rate is determined primarily by the requirement (arising both from regulation and accepted accounting practices) that the stream of payments the insurance company has contracted to make is matched by the stream of income that the company will receive from its investment. That is, at the time the annuity contract is signed, the insurance company will invest a sufficient amount, in secure financial instruments, that the income generated from that investment will be sufficient to fund the stream of payments the company has contracted to pay.

What this implies is that for each promised future payment, the insurance company will, implicitly make a separate investment that will generate sufficient returns that it will be able to cover the contracted payment at the appropriate date. For example, if it has contracted to pay $50,000 per year for ten years, it will make ten separate investments, each of which has a maturity value of $50,000.

The discount rate applicable to the payment that must be made one year from now is the interest rate currently available on one-year investments (such as one-year bonds); the rate applicable to the payment to be made two years from now is the interest rate currently available on two-year investments; etc. Thus, there could, in principle, be as many discount rates as there are time periods in the plaintiff’s stream of losses. (In practice, however, investments for more than ten or fifteen years tend to have the same interest rate, so a thirty-year annuity might require ten discount rates.)

Note, first, that there is not “a” discount rate. Rather, there is one rate for each year over which the stream of payments is to be made into the future.

More importantly, note also that it is not necessary to “predict” the discount rate(s). As the investments are to be purchased today (i.e. at the date of settlement), it is the interest rates that are available today that are to be used – and these rates are readily available.

Structured settlement: If it is assumed that a structured settlement is to be purchased, the argument concerning choice of a discount rate is similar to that for a life annuity. Again, the insurance company will place the lump sum received from the defendant in a series of investments, each of which will mature on the date that the payment is due. As the insurance company can be expected, once again, to purchase secure investments, the rates of return that are currently available on such investments can be used to determine the discount rate(s).

The Active Management Approach

Alternatively, the plaintiff might use his or her award to purchase a mixed portfolio of financial assets – for example, stocks, bonds, and mutual funds – selling and buying components within that portfolio as changes occur in financial markets. Because the individual is continuously selling old investments and purchasing new ones, the returns on those investments will reflect rising (and falling) rates that are available in the financial markets.

The complication that this approach introduces is that the rates of return that will be available at the times the plaintiff reinvests his or her funds are not known at the time that the court award is made. These rates must be predicted – in contrast to the rates employed in the annuity approach, which are known at the time the award is made.

2. Comparison of the Two Approaches

As the plaintiff’s award is intended to replace an ongoing loss, it is important that the income the plaintiff receives from investment of that award is sufficient, in each period, to provide the desired compensation. In turn, this requires that the rate of return on that investment be as predictable as possible. The less predictable is the rate of return, the less certain can the courts be that the award will be sufficient for its purposes.

The predictability of the rates of return obtained under the annuity and active management approaches differs with respect to three characteristics: volatility of the rate of return on the invested funds, uncertainty concerning the plaintiff’s life expectancy, and protection against unanticipated increases in the rate of inflation. In this section, we compare the two investment approaches with respect to each of these characteristics in turn.

Volatility

The volatility of a class of investments refers to the variability in the rate of return earned on those investments over time. According to one source:

… volatility refers to the amount of uncertainty or risk about the size of changes in a security’s value. A higher volatility means that a security’s value can potentially be spread out over a larger range of values. This means that the price of the security can change dramatically over a short time period in either direction. A lower volatility means that a security’s value does not fluctuate dramatically, but changes in value at a steady pace over a period of time. [investopedia.com, emphasis added]

The more volatile is the price of a security, the more likely it is that the rate of return on that security will deviate from its long run average. In some periods the return will rise above the average and investors will experience a windfall; but in other periods, the return will fall below average and investors will experience a shortfall.

In the very long run, high returns and low returns may average out, and the rate of return obtained will trend towards the long run value. However, many plaintiffs do not invest for a period long enough that they can be confident that the rate of return on investment of their awards will settle on the long run average. This will particularly be true if plaintiffs are unlucky enough to make a major investment shortly before markets enter a sharp downturn such as was experienced in 2008, (or lucky enough to invest shortly before an upturn, such as in 2010).

To avoid the uncertainty that may result if the plaintiff’s award is invested in volatile financial instruments, it is often recommended that they concentrate their investments on secure, non-volatile stocks, bonds, and mutual funds. The Canadian courts have confirmed this recommendation. For example, in its seminal decision in Lewis v. Todd (1980 CarswellOnt 617), the Supreme Court of Canada approved of an expert witness’s use of “high grade investments [of] long duration.” [para. 17]

Investments in life annuities offer the lowest volatility possible: essentially, the rate of return is guaranteed as long as the insurer, and its re-insurers, remains viable.

Investments in an actively managed portfolio experience two forms of volatility that are not found with annuities. First, all but the most conservative, high grade investments experience variations in returns from year to year.

Second, even if a sophisticated investor could avoid most year-to-year variations in the rate of return, no investor can protect him- or herself against variations that occur due to long-term changes in the economy. For example, assume that it had been anticipated that the plaintiff would be able to obtain a two percent rate of return on investment of his/her award, because the economy was expected to grow at that rate. If broad economic fundamentals should change, such that long run growth fell to one percent per year, it is unlikely that the individual investor would be able to maintain a two percent return on investments.

To conclude, if the goal is to minimize volatility in the returns on the plaintiff’s investments, life annuities and structured settlements are superior to active management, especially in the long run. For short periods of time, perhaps five or ten years, an actively managed “portfolio of high grade investments” may offer almost as much security as an annuity.

Life Expectancy

Assume that a plaintiff will require medical expenses of $50,000 per year for the rest of his life. In a personal injury action, his award will be calculated to ensure that if he invests that amount in a fund composed of secure investments, it will provide $50,000 per year for the lifetime of the average Canadian of his age and sex. For example, if he is a 50-year-old Canadian male his life expectancy is approximately 31 years, to age 81. Thus, his award will be calculated to ensure that he can remove $50,000 per year until his age 81, at which point the award have been drawn down (approximately) to zero.

This puts the plaintiff in a quandary: that the life expectancy of 50-year-old males is 31 years implies that (approximately) half of 50 year old males will live longer than 31 years (and half less than that). Thus, if the plaintiff spends $50,000 per year on medical expenses there is a 50 percent chance that his investment fund will be exhausted before he dies.

Alternatively, if he spends less than $50,000 per year, to leave money in the fund for the possibility that he will live beyond age 81, he will have insufficient funds in every year to pay for his required expenses. Even if it happens that the plaintiff lives less than 31 years, he will have been inadequately compensated for his necessary expenses, because he will have been taking the (reasonable) precaution of spending less than $50,000 per year to create a buffer for the possibility he will live longer than average.

In short, if plaintiffs invest their awards in actively managed investment funds, it is virtually certain that their awards will be insufficient to compensate them fully.

Furthermore, it can easily be shown that this outcome also arises when the amount to be replaced is a loss of income – although the shortfall will be less in this case than in the case of most medical expenses, because the impact of mortality is much lower when the loss continues only to retirement ages (when mortality rates are still low) than when it continues to the end of life.

If the plaintiff’s award is placed in a life annuity or structured settlement, however, payment of the desired annual compensation will be guaranteed from the date of settlement to the end date of the compensation period.

In short, whereas a life annuity will pay the plaintiff an amount equal to his or her loss in every year, an award invested in a portfolio of funds will, in most cases, undercompensate the plaintiff. This under-compensation will often be less when the award is intended to compensate for a loss of earned income than when it is to compensate for long term costs of care. Thus, on this ground, life annuities are slightly preferred to mixed portfolios of investments when there has been a loss of earnings; but annuities are definitely preferred when there is a long-term requirement for payment of medical expenses.

Unanticipated Inflation

A drawback to the annuity approach is that the stream of income that it provides may prove to be inadequate if inflation rates rise unexpectedly. For example, if an annuity provided for $10,000 per year, increasing each year at two percent (to allow for anticipated inflation), it would pay $12,190 in year ten. But if inflation proves to be four percent per year, the plaintiff will require $14,800 in year ten to buy what $10,000 would have bought in year one. The annuity will pay $12,190 when $14,800 is required.

It is often possible to buy annuities whose annual payouts increase with the actual rate of inflation. However, as the risk facing the sellers of annuities is quite high in this case, the price of these annuities may be higher than many buyers are willing to pay.

An alternative method of protecting against the effect of unanticipated inflation is to invest in an actively managed portfolio of assets. Under this approach, the individual is assumed to buy and sell financial assets on a continuing basis, replacing low-earning assets with higher-earning ones as market conditions change. If inflation increases, so will the returns on investments, particularly bonds, allowing the plaintiff to maintain a real rate of return (i.e. a rate net of inflation) that is consistent over time.

On this ground, if the rate of inflation cannot be predicted easily, the active management approach may be preferred to the annuity approach. However, central banks around the world have become convinced that one of their primary functions is to maintain a steady, low rate of inflation. The Bank of Canada, for example, has successfully targeted a rate of two percent since the early 1990s. This policy has been so well received that virtually all financial analysts expect this rate to be maintained well into the future.

As there is no reason to expect that the future rate of inflation will deviate significantly from the rate that has been experienced for the last twenty years, there is little reason to base the selection of the investment approach on the need to protect against unanticipated changes in the rate of inflation.

We conclude, therefore, that the ability of the active management approach to provide protection against unanticipated inflation does not offer a compelling reason to choose that approach in preference to the life annuity approach.

3. Summary

We summarise this section by investigating the merits of using the two investment approaches to replace (i) costs of medical care and (ii) losses of earnings.

Costs of Medical Care

For two reasons, if the plaintiff’s award is intended to provide compensation for medical expenses, particularly expenses that extend well into the future, we recommend that the award be invested in a life annuity (or structured settlement). First, as medical expenses are often required for the plaintiff’s entire life, it is important that the award is able to provide benefits should the plaintiff live beyond the average life expectancy. Whereas this can be achieved easily using a life annuity, it cannot be done through the active management approach.

Second, as the requirement for medical expenses often extends many decades into the future, the returns on awards invested in actively managed funds may be subjected to significant volatility, hence placing the risk of inadequate compensation on the plaintiff. The returns on a life annuity, however, are guaranteed by the insurer, thereby removing the risk of volatility from the plaintiff.

The contrary argument, for using the active management approach to the funding of future medical expenses, is that this approach allows for protection against unanticipated inflationary changes. We have argued, however, that such changes are not expected to be so large as to counter the arguments for use of life annuities. Furthermore, if the courts decide that inflation is likely to become an important factor, they can require that plaintiffs purchase inflation-protected life annuities.

We conclude that, in most cases, it should be assumed that when the plaintiff’s award is to provide for medical expenses, it will not be invested in actively managed funds but will, instead, be used to purchase life annuities. The exception occurs when medical expenses are required for only a short period of time.

Loss of Earnings

When the purpose of the plaintiff’s award is to replace a future stream of lost earnings, the argument in favour of life annuities is weaker than it was with respect to medical expenses. The reason for this is that earnings losses will generally end at an age at which the annual rate of mortality is still quite low.

For example, as we argued above, if a 50-year-old man has a life expectancy of 81, there is (approximately) a fifty percent chance that he will live beyond that age and will exhaust any award for medical expenses. Assume, however, that that individual had planned to retire at age 60, bringing any loss of earnings to an end at that age. As the probability of dying before age 60 is very small, the difference between an award that allowed for that probability and one that did not would also be small. Thus, any “error” that arose from using the active management approach might be compensated by other factors.

If we assume again that the risk of unexpected changes in inflation is small, then the primary difference between the annuity approach and the active management approach (with respect to losses of earnings) will arise with respect to volatility. On this basis alone, the annuity approach will be preferred as it offers less risk that an unanticipated fall in interest rates will leave the plaintiff’s award inadequate.

However, it is possible that this uncertainty concerning the rate of return on investments might be offset if the active management approach provided higher average rates of return. For example, if those rates were two or three percentage points higher than those offered by the sellers of life annuities, plaintiffs might prefer to manage their own funds rather than rely on an annuity.

For this reason, we suggest that the active management approach be employed only if it is clear that the plaintiff does not wish to invest his or her award in an annuity (as, in this case, the plaintiff has signaled that the rate of return on actively managed assets is high enough to compensate for the increased risk).

II. Evidence Concerning the Value of the Discount Rate

1. The Annuity Approach

If it is assumed that the plaintiff will purchase a life annuity, the appropriate discount rate will be the rate(s) of return that life insurance companies use when pricing those annuities. In this section, we argue that these rates will approximate the rates of interest that are available on Government of Canada bonds of the appropriate durations.

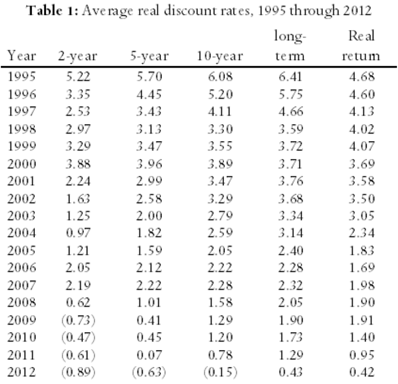
In Table 1, we summarise those rates for five-year, ten-year, long-term, and real rate of return bonds and for GICs of one-year, three-year, and five-year terms. In this table, the term “long-term bond” applies to government bonds with maturation dates of fifteen years or more. “Real rate of return bonds” are bonds whose rate of return is specified as a fixed value (the real rate of return) plus the actual rate of inflation. Thus, for example, if the fixed value is 1.0 percent and the rate of inflation proves to be 2.5 percent, the bond will pay (approximately) 3.5 percent.2

Table 1 reports both the nominal (observed) and real (net of inflation) rates of return on five- and ten-year bonds, long-term bonds, and GICs. In each case, the real rate has been calculated by reducing the nominal rate by the expected rate of inflation, two percent.3 As the interest rate on real rate of return bonds is reported as a real rate, we report only the real rate of return on those bonds.

In Table 1 it can be seen, first, that the real rates of return on government bonds increase as the duration of those bonds increase; thus confirming that there is not a single discount rate but rather a different rate for each length of investment.

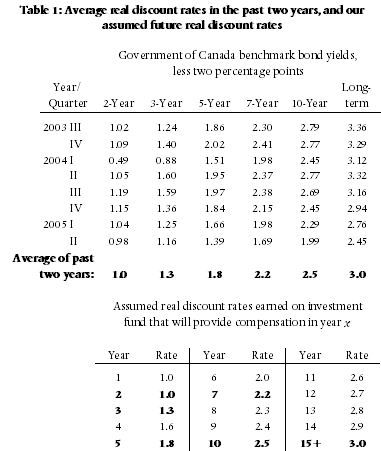
Second, it is also seen that the real interest rates on secure bonds have not recently risen above 0.5 percent for investments of any duration; and have risen above 0.0 percent only on real rate of return bonds.

Our contention is that these rates can be used as indicators of the rates at which life insurance companies will invest the funds they receive for life annuities and structured settlements. We can test this contention by comparing the interest rates employed to determine the prices of structured settlements against the rates reported in Table 1.

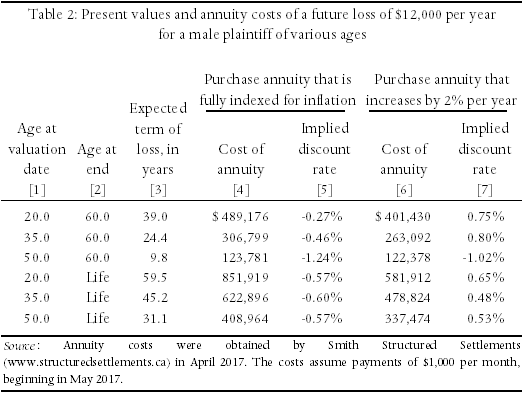
This we have done by obtaining quotes for several alternative structured settlements. From these we have been able to determine the interest rates that were employed to obtain those quotes. In Table 2 we report six such structured settlements, for males receiving $1,000 per month ($12,000 per year).4

Three scenarios represent payments that end at age 60 and three represent payments that continue to the date of the plaintiff’s death. (Those that end at age 60 are assumed to be typical of awards for loss of earnings; and those that continue for life are assumed to be typical of awards for medical expenses.) The assumed ages for the plaintiffs, at the date of trial, are, respectively, 20, 35, and 60. Furthermore, in each case we report quotes for both the situation in which the annual payment is to increase by two percent per year and for that in which it will increase by the actual rate of inflation.

Column (4) of Table 2 reports the quotes we received, assuming that the annual payment was to increase by the actual rate of inflation; while column (6) reports the quotes assuming that the annual payment was to increase by two percent per year. Columns (5) and (7) then report our calculation of the implied interest rates that were used to obtain the costs of the various annuities.

For example, the first figure in column (4) indicates that it would cost $489,176 to purchase an annuity that paid a male plaintiff $12,000 per year, indexed for inflation, for the next 40 years (i.e. from age 20 to age 60). The first figure in column (5) then indicates that the insurance company that quoted this amount had implicitly assumed that its investments would earn an average real rate of interest, (i.e. nominal interest net of inflation), of -0.27 percent over the 40-year period in question. Similar costs and real interest rates are reported for the other eleven scenarios.

Notably, in every case in which the payments were fully indexed for future inflation (column 5), the implied real rate of interest was negative – between -1.24 percent and -0.27 percent. It is only when the payments did not provide full protection against inflation – column 7, in which increases were limited to two percent per year – that insurers offered a positive real interest rate. Even then, rates were less than one percent.

We would note that the implied discount rates of the annuities presented in Table 2 are consistent with the implied discount rates of annuities offered  by private insurance firms such as Sun Life Financial and RBC Insurance. For example, the Sun Life Financial annuity calculator indicates that as of April 2017, a $1,000,000 annuity for a 50-year old female will provide an annual income of approximately $41,819 per year (with no inflation adjustment). This implies a discount rate of approximately 0.13 percent. The annuity calculator provided by RBC Insurance indicates that as of April 2017, a $1,000,000 annuity will provide a 55-year old male with annual payments of approximately $50,931 (with no inflation adjustment), for an implied discount rate of 0.15 percent.5

It is informative to compare the rates employed in the calculation of structured settlements (and private annuities) with the rates reported for government bonds, in Table 1. The two annuities with the shortest durations – ten years, from age 50 to 60 – had implied discount rates of -1.24 and -1.02 percent, both very similar to the figure of -1.23 percent reported in Table 1 for five-year bonds in 2016. Similarly, the two annuities with the longest durations – from age 20 for life – had implied discount rates of -0.57 percent and +0.65 percent, with an average very close to the figure of -0.08 percent reported in Table 1 for long-term government bonds.

We conclude from Tables 1 and 2 that, in cases in which the plaintiff purchases a life annuity or structured settlement – particularly one that is fully indexed for inflation – the discount rate can be estimated with some accuracy from the real rates of return currently available on Government of Canada bonds of appropriate durations.

2. Active Management Approach

In the active management approach, it is assumed that plaintiffs will re-allocate funds within their investment portfolios as conditions in financial markets change. Because these changes will be made in the future, the active management approach requires that estimates of future rates of return be calculated.

In this section, we first identify the type of financial instrument in which we assume the plaintiff will invest. We then contrast two methods of forecasting the rates of return on those instruments. Finally, we provide estimates of those rates of return.

Selection of the Appropriate Financial Instrument

The courts have been clear that, as the lump-sum award is intended to replace the plaintiff’s lost earnings, the investments in the plaintiff’s portfolio must not expose the plaintiff to unreasonable risk. For example, in its seminal decision in Lewis v. Todd (1980 CarswellOnt 617), the Supreme Court of Canada approved of the expert’s use of “high grade investments [of] long duration” [para. 17].

As the rates of return on investments in the stock market have historically been very volatile, it is usually recommended that plaintiffs do not restrict their investments to equities. Table 3, for example, reports the value of the Toronto Stock Exchange composite index for July of each year since 2000. It can be seen there that rates of return have been highly volatile, indicating that the rate available to an individual whose investments tracked the market would have depended importantly on the year in which those investments were made. For example, whereas the nominal return on investment in such a portfolio would have averaged 2.2 percent per year between 2000 and 2015, a similar investment would have averaged 6.2 percent per year between 2002 and 2015.

In light of this issue, two approaches might meet the court’s requirement that plaintiffs invest in high grade investments: it could be assumed that plaintiffs will purchase long-term Government of Canada bonds; or that they will invest their awards in financial instruments that offer higher yields than government bonds, but with greater risk – for example, in a mixed portfolio of “blue chip” stocks, corporate bonds, and mutual funds. In the discussion that follows, we will consider both.

Forecasting the Returns on Government Bonds

Two methods have commonly been used to forecast the rate of interest that will be available on government bonds. The first of these, the historical approach assumes that future rates will equal those that were observed in the past. The second, the efficient market approach, assumes that the rates that are currently available in the market reflect the rates that investors believe will prevail in the long run. We explain here why we prefer the efficient market approach.

The historical approach: A fundamental problem with the historical approach is that real interest rates have varied significantly over the last sixty years. As can be seen from Table 4, real rates were as low as 1.50 percent in two decades (1951-1960 and 1971-1980) and as high as 4.70 percent in two others (1981-2000). From this record, it would be possible to find support for almost any long-run rate between 2.0 and 5.0 percent.

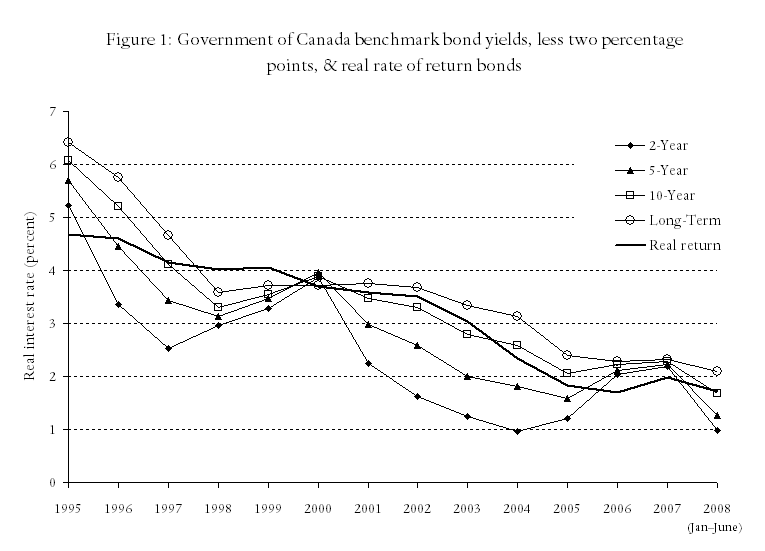
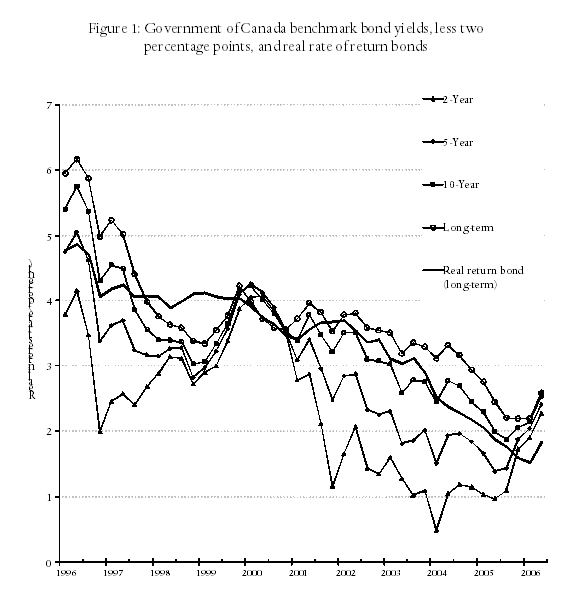
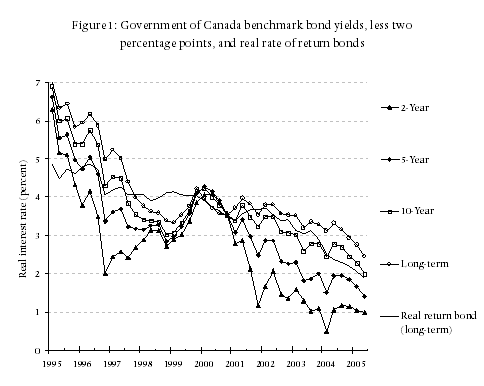
More importantly, as indicated in Figure 1, real rates of return have declined virtually continuously for the past twenty years, from approximately 5.5 percent to -0.5 percent. Even if it was to be argued that real rates of interest will return to, say, 3.0 percent over the next twenty years, most plaintiffs will experience rates of return well below that over most of the period in which their award is invested.

A third problem with the use of historical rates is that there is no theory to support it. Adherents simply assume that because real rates took some value in the past, rates will return to that value in the future. Furthermore, they make this assumption in the face of the long run decline in real interest rates reported in Figure 1. If the markets expected the real rate of interest to return to “long-run” levels soon, sophisticated investors would not continue to purchase financial instruments that paid long-run rates as low as -0.08 percent (Table 1).

Finally, the evidence is not just that the real interest rate has declined significantly; this decline is consistent with theoretical predictions. Importantly, as central banks have adopted a policy of maintaining inflation within a narrow band of rates (in Canada, between 1.0 and 3.0 percent), uncertainty about the rate of inflation has been minimized. This reduction in risk has led to an increase in demand for bonds, and an associated reduction in real interest rates.

The Congressional Budget Office of the United States also predicts that interest rates will be lower in the future than in the past, resulting in part from slower growth rates of both the labour force and of productivity, thereby reducing the rate of return on capital; and in part from a shift of income to high-income households who tend to have high savings, thereby increasing the supply of money to the bond market.

The efficient market approach: The second source of information concerning future real rates of interest is the money market. When an investment firm that believes that inflation will average two percent per year purchases twenty-year Government of Canada bonds paying three percent, it is revealing that it expects the real rate of interest on those bonds will average approximately one percent over those twenty years. Thus, if the rate of inflation that investors were forecasting was known, that forecast could be used to deflate the nominal rates of interest observed in the market to obtain the implicit, underlying forecasts of real rates.

A strong case can be made for using an expected inflation rate of two percent. The reason for this is that in the last decade the Bank of Canada has not only made this its target rate of inflation, it has been successful in keeping the actual (long-run) rate of inflation very close to that target (which, in turn, has led most financial institutions to predict that future inflation will average two percent).6

Furthermore, in choosing to target a low rate of inflation, the Bank has been following a view that has achieved widespread acceptance in the economics community – that is, that control of inflation, at a low level, should be one of central banks’ primary roles.

On this basis, at the end of 2016 the real rate of interest on long-term government of Canada bonds appeared to be as little as 0.00 percent. (See the figures for long-term bond rates in Table 1.)

An alternative approach is to rely on information concerning bonds whose rate of return is denominated in terms of real interest rates – called real return bonds, or RRBs. By observing the rates of return at which these bonds sell, the risk free real rate of return that investors believe will prevail over the long run can easily be determined. That is, even if plaintiffs do not purchase RRBs, the real rate of interest that is observed on those bonds provides an unbiased indicator of the rate of interest that is expected by sophisticated investors. In Table 1, it is seen that the return on these bonds has recently fallen to as little as 0.41 percent.7

Forecasting Returns on a Mixed Portfolio

Forecasting the returns on a conservative, mixed portfolio is complicated by the fact that there is no common agreement about what the components of such a portfolio should be. Hence, not only is it difficult to obtain the current rates of return on conservative investments, there is also very little information about how such returns have varied over the past. Both issues complicate the forecasting process.

An approach that we suggest might mitigate this problem would be to rely on the rates of return that have been available on conservative portfolios offered by Canadian banks. We have been able to obtain information about four of these: the RBC Select Very Conservative Portfolio, CIBC Managed Income Portfolio, TD Comfort Conservative Income Portfolio, and ScotiaBank Selected Income Portfolio-Series A. Although these funds differ from one another in their details, they all have investment objectives similar to those stated for the RBC portfolio:

To provide income and the potential for modest capital growth by investing primarily in funds managed by RBC Global Asset Management, emphasizing mutual funds that invest in fixed-income securities with some exposure to mutual funds that invest in equity securities. The portfolio invests in a mix of Canadian, U.S. and international funds.

To achieve this goal, RBC invests primarily in bond funds. The result, seen in the first columns of Table 5 below, is that since 2011 this fund has consistently earned a nominal rate of return between 2.5 and 5.0 percent – with one deviation, to 6.74 percent, in 2014 – suggesting a real rate of return over that period of approximately 1.0 to 3.5 percent. Table 5 reports similar results for the other three portfolios (again, with 2014 being the only year that each of them achieved a nominal return that exceeded 5.00 percent).

The volatility in the rates of return on all four portfolios reported in Table 5 is considerably less than that on investments in the Toronto Stock Exchange, as reported in Table 3.

But that does not necessarily mean that plaintiffs would be advised to invest in a conservative mixed portfolio. Although the returns on such portfolios may be higher than that on life annuities, the returns on the latter are fixed once they are purchased, and hence have lower (zero) volatility than the returns on all other investments. The question remains: do the higher rates of return on mixed portfolios compensate the plaintiff for the higher volatility of their returns? This is a question that cannot be answered by financial experts, but only by the courts or government regulators.

What Table 5 does suggest, however, is that if plaintiffs had purchased mixed conservative portfolios in the last five years they would have achieved average nominal returns of between 3.5 and 4.5 percent per annum – or approximately 2.0 to 3.0 percent in real terms. This suggests that 2.5 percent represents a conservative estimate of the real rate available to plaintiffs seeking conservative investments.

III. Summary

In personal injury and fatal accident actions, the plaintiffs are assumed to invest their awards in such a way as to provide streams of returns that will replace their future annual losses. Two factors may intervene to hinder plaintiffs’ ability to achieve this goal. First, they may live longer than average. Second, the rate of return on investments may fall below the level that was anticipated when calculating their awards. In both cases, the award will be exhausted before the plaintiff’s death.

One approach plaintiffs can employ to avoid these problems is to invest their awards in life annuities or structured settlements, as these instruments guarantee a specified annual payment for life, and as the rates of return available on them are fixed.

The drawback to annuities is that the interest rates that insurance companies use to price their products are much lower than the rates of return that have been available on conservative mixed portfolios of financial assets. We showed in Section II that, whereas the implicit interest rates on life annuities are similar to the rates available on long-term Government of Canada bonds, or approximately 0.0 to 0.5 percent, the interest rates available on conservative portfolios of assets have been approximately 2.0 to 3.0 percent.

If a loss will not continue into the years beyond which mortality rates begin to rise substantially, the advantage of buying a life annuity may be relatively small compared to investing in a portfolio of assets. In that case, it may be appropriate to assume that that the discount rate can be estimated from the return on a portfolio of assets.

If the loss will continue into years of high mortality, however, the benefits of a life annuity (protection against exhaustion of the award) may exceed the costs (a lower rate of interest).

As it is only the plaintiff who can determine whether the benefits of a life annuity exceed the costs, it seems appropriate that the discount rate be chosen based on the plaintiff’s decision whether to self-manage the investment of his or her award or to use that award to purchase a life annuity (or structured settlement).

  • If the plaintiff chooses to self-manage his or her award, we recommend that the discount rate be set at 2.5 percent.
  • If the plaintiff chooses a life annuity or structured settlement, we recommend that the discount rate be set at zero percent.
  • We anticipate that plaintiffs will make the latter choice in virtually all cases in which their losses will continue into years of high mortality.
 

The Effect of Incarceration on Future Earnings

by Christopher J. Bruce, Derek W. Aldridge

In personal injury and fatal accident claims, the courts are often required to determine what effect a criminal record would have had on the earnings of the plaintiff. We suspect that most individuals would expect that criminals will have lower wages and higher unemployment rates than the average citizen.

In this paper, we summarise the most reliable research that has been conducted into this question. We divide this summary into four lines of investigation: the impact of incarceration on earnings and employment; the effect of an increase in the duration of incarceration; the determinants of a successful transition from jail to civilian life; and the determinants of the probability of recidivism.

Incarceration

Although the raw data indicate that those who have been incarcerated have lower earnings and higher unemployment rates than those who have no criminal record, research indicates that this is an example of “correlation, not causation.” (For further information on the misuse of statistics in legal proceedings, see Bruce, 2004.) That is, careful analysis of the data have shown that individuals with low earnings and high unemployment rates are more likely to commit (and be convicted of committing) crimes than are those with high earnings and low unemployment rates. Hence, the primary reason that earnings are low among those who have been incarcerated is that those individuals are drawn from a population of individuals who have low earnings, not because the incarceration changed their employment prospects.

Grogger (1995), for example, found that neither arrests nor jail terms had long term effects on the earnings or employment of young men. And Kling (1999) concluded that, for most individuals, incarceration only reduced earnings by 0 to 3 percent, five to eight years after release. The only group for whom incarceration had a significant effect on post-release earnings was white collar criminals (such as accountants and stockbrokers). Similarly, Richey (2015) found that the effect of conviction on earnings was small or zero. Western (2002), however, found that although conviction had no effect on employability, it reduced the rate of growth of earnings by approximately 33 percent. (Note, however, that as rates of growth are often approximately two or three percent per year, a 33 percent reduction implies a reduction in rate of growth of approximately one percent or less.)

Duration of incarceration

A number of recent articles have attempted to determine whether an increase in the length of a jail sentence, holding the severity of the crime constant, has an effect on post-incarceration employment and earnings. One study found that there “…. is no substantial evidence of a negative effect of incarceration length on employment or earnings.” (Kling, 2006) Another found that the length of prison sentence for drug offences had no significant effect on earnings; but that length of sentence had a very significant effect with respect to incarceration for fraud and embezzlement. (Lott, 1992)

Transition from prison into the workplace

A small number of studies have investigated the factors that influence the success of transition out of prison. Typical of these is Visher and Travis (2003) in which the authors found that men with close ties to families and friends made the most successful transitions into the workplace, particularly if they lived with their wives and children. Families appeared to be especially important if they provided emotional support and housing assistance.

Recidivism

Numerous studies – e.g. Gendreau et. al. (1996), Jones (2005), and Motiuk and Vuong (2005) – have concluded that those who have been released from prison are more likely to reoffend if they have experienced high levels of unemployment or job instability, lack a skill or trade, or are drug users. They are also more likely to reoffend the younger they are.

The finding that it is younger individuals who are most likely to re-offend implies that most offenders have left the criminal population by the time they are in their late 20s. One Canadian study (Correctional Service of Canada, 1993), found that, at age 32, the average age at which respondents had committed their last offence was 23. A subsequent study (Ouimet and LeBlanc, 1996), based on interviews with 238 young men who had previously been young offenders, found that whereas more than half had been criminally active between the ages of 18 to 25, only 18 percent had been criminally active after 25.

Summary

The scientific literature suggests that incarceration has a relatively small effect on lifetime earnings. Although those who have been incarcerated earn lower incomes than those who have not been incarcerated, it is primarily because they are drawn from a group that tends to have relatively low earnings, not because the incarceration “causes” low earnings. Further, the data appear to indicate that the likelihood of being convicted and sent to jail decreases as an individual ages. Hence, those 30 and 40 year olds who were incarcerated in their early 20s are not likely to become repeat offenders.

It appears, therefore, that once a plaintiff reaches the age of approximately 25, the best predictors of his future earnings are standard factors like earnings history, education, and occupation. Whether or not that individual has been incarcerated will not add a significant amount of information to the factors that are used to forecast earnings of non-incarcerated individuals.

Sources

  • Bruce, Christopher, (2004) “The Reliability of Statistical Evidence Concerning the Impact of Disability;” Expert Witness, 9(4), http://www.economica.ca/ew09_4p1.htm.
  • Correctional Service of Canada, (1993) “Recidivists tend to be…;” Forum on Corrections Research, 5(3).
  • Gentreau, P. et. al. (1979) “Norms and recidivism for first incarcerates: Implications for programming;” Canadian Journal of Criminology, 1-26.
  • Grogger, J. (1995) “The effect of arrests on the employment and earnings of young men;” Quarterly Journal of Economics, 51-71.
  • Jones, D. (2005) “Offender employment: A research summary;” Forum on Corrections Research, 17(1), 13-20.
  • Kling, J. (1999) “The effect of prison sentence length on the subsequent employment and earnings of criminal defendants;” Woodrow Wilson School Discussion Papers in Economics.
  • Kling, J (2006) “Incarceration length, employment, and earnings;” American Economic Review, 863-876.
  • Lott, J (1992) “Do we punish high income criminals too heavily?;” Economic Inquiry, 583-608.
  • Motiuk, L, and B. Vuong (2005), “Offender employment: What the research tells us;” Forum on Corrections Research, 17(1), 21-24.
  • Ouimet, M., and M. LeBlanc (1996) “Life events in the course of the adult criminal career;” Criminal Behavior and Mental Health, 6(1), 75-97.
  • Richey, J. (2015) “Shackled labor markets: Bounding the causal effects of criminal convictions in the U.S.;” International Review of Law and Economics, 41, 17-24.
  • Visher, C., and J. Travis (2003) “Transitions from prison to community: Understanding individual pathways;” Annual Review of Sociology, 29, 89-113.
  • Western, B. (2002) “The impact of incarceration on wage mobility and inequality;” American Sociological Association, 4, 526-546.

leaf

Christopher Bruce is the President of Economica and a Professor of Economics at the University of Calgary.

Derek Aldridge is a consultant with Economica and has a Master of Arts degree (in economics) from the University of Victoria.

Implied Rates of Return on Structured Settlements

by Derek Aldridge & Christopher Bruce

The purpose of a lump sum award in a personal injury or fatal accident case is to provide a fund that, when invested, will generate a stream of benefits equal to the plaintiff’s future stream of losses. One method of generating such a stream would be to purchase a life annuity. This, for example, is what is anticipated by Section 19.1 of the Judicature Act (RSA 2000) when it provides that:

(2)  On application by any party to a proceeding, the Court may order that damages awarded be paid in whole or in part by periodic payments…

This type of periodic payment has come to be known as a structured settlement annuity. Such annuities are sold by insurance companies. When calculating the price it is going to charge for an annuity, the insurer determines how much it would have to invest, at current interest rates, in order to generate a stream of income at least equal to the required periodic payments. For example, if it had promised to pay $10,000 per year indefinitely , and the rate of interest that it thought it could earn was 10 percent, it would charge at least $100,000 – as $100,000, invested at 10 percent per year, would generate a stream of income of $10,000 per year.

Conversely, therefore, if we observe the lump sum that an insurance company charges for an annuity that promises a specified stream of payments, we can calculate the rate of interest that the insurance company expects to obtain on the investment of that sum. For example, if it was observed that the company had charged $100,000 for a periodic payment of $10,000 per year (indefinitely)¹, we would be able to calculate that the rate of return it expected to obtain on investment of that $100,000 was at least 10 percent.

We have used this principle to calculate the rate of return that insurers expect to obtain on a series of standard structured settlements. By contrasting these rates of return with the rates that Economica has been using, we can check whether Economica’s rates are consistent with those that sophisticated investors – insurance companies – expect to earn on low-risk investments.

With the assistance of Heber Smith, of Smith Structured Settlements (www.structuredsettlements.ca), in August 2011 we obtained quotes on an annuity that provided payments of $1,000 per month to a male plaintiff. These quotes were for

  • three different ages of plaintiffs: 20, 35, and 50;
  • two different termination dates: the plaintiff’s age 60 and his age of death; and
  • two different assumptions concerning inflation indexation: one in which the insurer increased the annual payment each year by the rate of consumer price inflation and one in which the payment was increased each year by a fixed 2 percent.

We report the quotes that we obtained for twelve different scenarios in columns 6 and 8 of the table below. As an example of how to read this table, the $127,064 figure in column 6 of the first row in the table, indicates that we were quoted a price of $127,064 to purchase an annuity that paid $1,000 per month, increasing at the rate of consumer price inflation, from the plaintiff’s age 50 to his age 60. Similarly, it is seen from column 8 of the first row that that annuity would have cost $121,255 if the payments had been adjusted by 2 percent per year instead of by the prevailing rate of inflation. (If we assume that insurers believe that inflation will be 2 percent on average, the difference be $5,809 difference between columns 6 and 8 in the first row is a “premium” the insurer charges to compensate it for taking the risk that inflation might prove to be higher than 2 percent.)

The comparable figures in columns 6 and 8 of the third row of the table report the cost of an annuity that extends to the end of the plaintiff’s life, instead of to age 60 (as in the first row). The figures in the third row would be relevant if an annuity was being purchased to pay for costs of care, instead of for loss of earnings (first row). The remaining rows in the table report the costs of annuities paying $12,000 per year to a 20-year old and a 35-year old.

Given the quotes reported in columns 6 and 8, we were able to calculate the real rate of interest (interest rate net of a two percent expected rate of inflation) the insurance company was expecting to receive from investment of each annuity. These rates are reported in columns 7 and 9, with the figures in column 7 referring to the quotes in column 6 and the figures in column 9 referring to the quotes in column 8. As an example, the figure of -0.95% in column 9 of the first row indicates that the insurance company anticipated that it would receive a nominal interest rate of approximately 1.05% (i.e. 1.05% nominal interest – 2.00% inflation = -0.95% real rate of interest, or discount rate).

Of the twelve discount rates reported in the table, only one – the 2.10 percent rate of return in column 9 of the second row – exceeds the lowest rate used by Economica, as reported in Table 2 of the first article in this newsletter – 1.80 percent on investments of less than four years; and most of the remaining discount rates are significantly lower than the rates that we recommend.

The result is that the present discounted values quoted by insurance companies for the purchase of structured settlements are considerably higher than the comparable values that would have been calculated by Economica. The latter values are reported in column 4 of the table. It is seen in column 4 of row four, for example, that whereas Economica would have calculated that a plaintiff would need $277,538 to replace $12,000 per year from age 20 to age 60; the quote we received for a structured settlement was $506,890 – 82.6 percent more.

The differentials are even greater if we use the discount rate that some other expert economists have recommended – 3.50 percent. In the fourth row of column 5, for example, we report that the present value of $12,000 from age 20 to age 60 would be $252,895 if 3.50 percent is used – less than half of the $506,890 that we were quoted for a structured settlement.

To conclude: in every case, the present values that we would estimate using our discount rate assumptions are considerably lower than the actual cost that a plaintiff would incur if he were to buy an annuity to fund his future losses. This is very strong evidence in support of the claims that we have made over the last several years that our discount rate approach is a conservative one. Based on the costs to purchase structured settlement annuities, and the plaintiff’s ability to demand that his/her loss be funded using this “periodic payment” approach (given Section 19.1 of the Judicature Act), it follows that any reasonable change to our discount rate approach would be to use lower rates, not higher (as some other experts have argued).

Acknowledgment

As noted above, Heber Smith, of Smith Structured Settlements generously provided us with quotes on various annuities which we used in the creation of this article. On previous cases, we have worked together with Mr. Smith when the plaintiff’s lawyer chose to argue that damages should be satisfied by periodic payments (in accordance with Section 19.1 of the Judicature Amendments Act), rather than a conventional present value. An advantage of having future losses assessed in this manner is that it removes the subjective nature of opinions concerning the discount rate. Instead of relying on opinion concerning the rate of return that a plaintiff will earn on his or her investments, we can determine precisely how much it will cost the plaintiff to purchase annuities to fund the future losses.

Smith Structured Settlements serves the personal injury community as an annuity brokerage specializing in the preparation of fee-based Section 19.1 damages reports. Should you wish to investigate such an option they may be reached at www.structuredsettlements.ca.


Footnote:

  1. Of course, structured settlements never continue indefinitely. We use this example because of its mathematical simplicity. [back to text of article]

The Discount Rate Simplified

by Christopher Bruce, Laura Weir, Derek Aldridge, and Kelly Rathje

In every personal injury or fatal accident case in which the plaintiff’s loss continues into the future, it is necessary to calculate the rate of interest at which the damages will be invested. This interest rate is commonly called the discount rate, and it is calculated as the nominal (or observed) rate of interest net of the expected rate of price inflation.

As Alberta has no mandated discount rate, the determination of that rate is left to the courts. In this article, we propose to offer a simple technique for identifying this rate.

We proceed in two steps. First, we discuss the criteria that we believe must be met when selecting the discount rate. Second, we apply these criteria to the relevant data, to make that selection. In a separate article following this one, Derek Aldridge and Christopher Bruce contrast the rates that we propose with those that are available on structured settlements.

1. Criteria

The first step in selecting a discount rate is to recognise that the plaintiff is expected to invest his or her award in such a way that the stream of income generated from that award will exactly reflect the stream of losses that the plaintiff has suffered. If the plaintiff has lost $50,000 per year for twenty years, investment of the lump-sum award should produce $50,000 per year, with the principal being exhausted by the end of the twentieth year.

As this stream of investment income is intended to replace a significant portion of the plaintiff’s lifetime earnings, the courts have ruled that the lump-sum should be invested in low-risk financial instruments. Hence:

The discount rate must be based on an investment portfolio that is of low risk.

Although this requirement does not mean that the plaintiff must put all of his or her award into government bonds or guaranteed investment certificates (the lowest-risk investments available), we argue that the interest rate available on those investments provides the most reliable indicator of the rate of return required by the courts.

The plaintiff may well include in his/her portfolio non-government or non-guaranteed investments, such as corporate bonds, mutual funds, and blue chip stocks; but, that the returns on such investments are higher than those obtained from government bonds results primarily from the higher level of risk associated with them – as was seen with devastating results in the post-2008 stock market crash.

The difference between the rate of interest on a government bond or a GIC and, say, a corporate bond is a measure of the compensation that investors demand for accepting a higher degree of risk on the latter investment than on the former. Once that level of “compensation” is deducted, the net, risk-free, interest rate is approximately the same on both. Hence:

The rates of return on Government of Canada bonds and GICs represent reliable indicators of the rate of interest sought by the courts.

Once it has been decided that it is government bond and GIC rates that are to be used, it is necessary to select from among the various options that are available to the plaintiff. Financial advisors recommend that, in order to reduce risk, investors should purchase a mix of bond durations. In that way, if interest rates should rise, investors can sell their short-term bonds and purchase newly-issued bonds at the higher rates; and if interest rates should fall, although investors will have to accept reduced interest rates on any new investments, they will still experience relatively high rates on their long-term (locked-in) investments. Hence:

Plaintiffs should purchase a mix of short-, medium-, and long-term investments.

If the duration of the plaintiff’s loss is less than ten years, the plaintiff will minimize risk by purchasing investments that have durations that mature on the dates on which the losses are incurred. For example, a one-year bond might be purchased to replace the loss one year in the future, a two-year bond to replace the loss two years from now, etc. Hence:

For losses that will occur in the next ten years, the relevant interest rate for any year is the rate of interest on a Government of Canada bond (or GIC) that has a term equal to that number of years.

But if the plaintiff’s loss extends for more than ten years, it will be wise to adopt an investment strategy in which bonds are purchased for shorter terms than the duration of the loss, and then re-invested periodically. To replace a loss twenty years from now, for example, the plaintiff might purchase five-year bonds today and re-invest the returns every five years until the funds were needed. If a similar practice is followed for every duration of loss, the risk that interest rates will rise or fall, relative to what is expected at the time of the initial investment, will be minimised.

Such a strategy, of rolling over short-term investments in order to generate a long-term return, means that the effective discount rate over the term of the investment will be determined not only by the rates that are available today but also by rates that will become available in the future. Thus, the court must predict what those future rates will be.

Contrary to what many experts argue, this prediction can be made simply and with confidence: the most reliable prediction of the rate of interest that will prevail in the long-run is that it will equal the rate of return currently available on long-run bonds. For example, if the current rate on 15-year government bonds is 3.0 percent, the best prediction of the rate of return that will prevail over the next fifteen years is 3.0 percent.

The argument for basing the prediction on this rate can most easily be understood by showing that the contrary cannot be true. For example, it might be argued that “as interest rates are unusually low today, it can be expected that they will eventually rise above current rates.” If this argument is correct, then individuals who wished to invest their funds for long periods of time (for example, individuals who are saving for their retirement) would not purchase long-term bonds today – they would purchase short-term bonds while waiting for interest rates to rise, and then purchase bonds at the new, higher rates once the interest rate had risen.

But if investors behaved this way, the demand for long-term bonds would decrease; and when demand for a bond decreases, its interest rate rises. (Issuers have to raise the rate of return in order to attract investors.) That is, if investors predict that the long-term interest rate will exceed the rate currently available on long-term bonds, they will act in such a way as to drive up the interest rate on long-term bonds. A bond rate that is less than the expected rate cannot be maintained.

Similarly, if investors believed that interest rates were about to fall, they would sell their short-term bonds and purchase long-term. But this would decrease the demand for short-term funds, driving up short-term interest rates, and increase the demand for long-term funds, driving down long-term interest rates.

In short, if the rate of interest that is currently available on long-term bonds is different from the rate that investors expect will prevail in the future, the long-term bond rate will change “towards” the rate that investors predict. As a result, the interest rate available on long-term bonds will always adjust until it equals the rate that investors predict will prevail in the long run. And, as investors have a strong incentive to make correct predictions about the bond market, it is likely that their predictions are the best that are available. Hence, we conclude that:

The best predictor of the rate of interest that will prevail in the long-run is the rate of interest that is currently offered on long-term bonds.

Finally, as we noted in the introduction to this article, the discount rate is found by netting out the forecasted rate of price inflation from the observed nominal rate of interest. Hence, before the discount rate can be determined:

The long-run rate of price inflation must be forecast.

Fortunately, there is a clear consensus that the long-run rate of inflation in Canada will be two percent. This consensus has developed because, since the early 1990s, the Bank of Canada has not only set two percent as its long-run target, it has both met that target and expressed satisfaction with the results of its policy.

That participants in the “money markets” have come to accept that the Bank will achieve this goal over the long-run is seen in two surveys of business leaders that have been conducted annually since 1994. Consistently, respondents have reported that they expect the long-run rate to be 2.0 percent. Indeed, not only has the average, expected rate been 2.0 percent in most years that the surveys were conducted, the variation of responses “around” 2.0 percent has decreased continuously. Hence:

There is a strong consensus that, in the long run, the rate of inflation will average 2.0 percent in Canada. Hence, the discount rate can be found by reducing the forecasted nominal rate by 2.0 percent.

2. Data

In Figure 1 and Table 1 we report the annual rates of return that have been available since 1995 on five Government of Canada bonds: 2-, 5-, and 10-year bonds, long-term bonds (an average of bonds with a maturity date longer than 10 years), and “real rate of return” bonds (bonds whose rates of return are stated net of inflation). It is seen there that both nominal and real interest rates on Government of Canada bonds have decreased almost continuously since the Bank of Canada introduced its policy of targeting a two percent rate of inflation. Whereas real interest rates were between 4.5 and 7.5 percent in 1995, they have fallen below one percent on most bonds, and even below zero percent on some, in recent years.


What these figures indicate is that investments in government bonds are unlikely to provide real rates of return above zero percent over the next five years; that bonds of five to ten year durations are unlikely to produce rates in excess of 1.0 percent; and that the market expects long-term real interest rates on government bonds to be less than two percent.

Nevertheless, in recognition of the fact that current rates are at a historical low, we have left our assumed rates at the same values we have employed for the past five years. Those rates, which we report in Table 2, are: 1.8 percent per year on funds invested for three years or less; rising in equal increments to 3.0 percent per year on funds invested for more than fifteen years.


leaf

Christopher Bruce is the President of Economica and a Professor of Economics at the University of Calgary. He is also the author of Assessment of Personal Injury Damages (Butterworths, 2004).

Derek Aldridge is a consultant with Economica and has a Master of Arts degree (in economics) from the University of Victoria.

Kelly Rathje is a consultant with Economica and has a Master of Arts degree (in economics) from the University of Calgary.

Laura Weir is a consultant with Economica and has a Bachelor of Arts in economics (with a minor in actuarial science) and a Master of Arts degree from the University of Calgary.

Factors that Influence Retirement

by Derek Aldridge

This article first appeared in the Autumn 2011 issue of the Expert Witness.

We often note in our reports that a plaintiff’s loss of income can be sensitive to assumptions regarding his retirement age. (The retirement age assumption will generally be more important for a plaintiff who is close to retirement than for one who is still many years away.) In addition, it is also sometimes reasonable to incorporate early retirement scenarios, in which we assume that due to his residual deficits, a plaintiff will retire earlier than he would have if uninjured. This can have a substantial impact on the plaintiff’s future loss of income, especially if he is already close to retirement age.

The reason that an early with-accident retirement scenario is often sensible is because a person’s health is an important factor in his decision to retire. That is, poor health tends to hasten retirement, all else being equal. Of course, there are other factors that also influence a person’s decision to retire (financial considerations being most important, but also job satisfaction, spousal influences, and so forth), but health is an important factor, especially with respect to unplanned retirement.

Two articles that examine health impacts on retirement were recently published in Statistics Canada’s Perspectives on Labour and income. The first article (Heath factors and early retirement among older workers) used 12 years of longitudinal data1 to examine the various health factors that caused people to retire early. The second article (Retirement, health and employment among those 55 plus) used a cross-sectional survey2 of Canadians age 55 and over, to examine the reasons why they were either working (and not previously retired), partially retired, fully-retired, or previously retired but now working. Below, I will discuss some of the findings in these articles that are relevant to estimating a person’s loss of income due to an injury.

Health factors and early retirement among older workers (Park, 2010)

The first article relied on data from a group of workers who were age 40–52 in 1994/95. The survey interviewed this group every two years, through 2006/07, by which time they had reached age 52–64. By the end of the 12-year period, approximately 20 percent of the workers had left the labour force. However, among those who reported that they had fair or poor health, 35 percent had stopped working. Among those workers in poor health who stopped working, almost half reported that illness or disability was the main reason they had exited the labour force.

More specifically, the article found that when compared with men who reported that they had excellent health, men who reported fair or poor health were nearly five times more likely to exit the labour force. The researchers found a weaker health effect among women, and this effect was judged to be not statistically significant.3 The stronger effect among men was indeed found to be statistically significant. Among men, it was found that eye problems, back pain, ulcers, and migraine headaches were especially likely to increase the likelihood of retirement.

The researchers also examined health behaviours, and found that among men, daily smoking and heavy drinking also increased the chance of labour force exit (relative to males who did not practice these behaviours). In particular, male heavy drinkers were almost twice as likely to exit the labour force early, versus those who did not drink heavily. Among women, the one health behaviour that was judged to be statistically significant was obesity. Obese women were found to be 1.6 times more likely to exit the labour force early.

The article reported that if health status was controlled for, the effects of smoking and obesity disappeared. That is, smoking and obesity directly impact health, which in turn impacts retirement. Thus, the link between smoking/obesity and retirement is an indirect one. However, heavy drinking had a direct influence on retirement, even when overall health was controlled for. That is, heavy drinking was observed to be associated with early retirement among men, independent of the impact of drinking on the men’s health.

Although it is not especially relevant in the context of personal injury claims, the article also noted that working conditions had a significant impact on the likelihood of labour force exit. In particular, high job strain (stress), job dissatisfaction, and low supervisor support were all found to have statistically significant effects on retirement behaviour.

Retirement, health and employment among those 55 plus (Park, 2011)

The second article relied on a survey of a group of “older” Canadians, aged 55–85 in 2009. The survey group was divided into four subgroups: those who had never retired, those who were partially retired, those who were fully-retired, and those who had previously retired but had returned to work. The characteristics of the four groups were examined, in an effort to determine which characteristics were associated with a person’s retirement status.

The study reported some unsurprising results (for example, women were more likely to be retired than men; most of the workers who had never retired were under age 65, and so forth), and then addressed some issues that are much more interesting from our perspective.

Even when the age differences were accounted for, the study found that the retirees had worse health than those who were not retired. More than half of the retirees reportedly had three or more chronic conditions4, while more than a fifth had five or more chronic conditions. This effect was more pronounced among women than men.

The study also considered physical inactivity and found that retirees were much more likely to be considered physically inactive than those who were working.

Another factor considered by the study that is interesting from a personal injury perspective is financial status. The study reported that nearly 40 percent of the “never retired” workers reported that they had inadequate financial plans for retirement. More specifically, more than a third of them reported that they had less than $25,000 in savings and investments. In addition, among the groups who had retired at least once, the most common reason they reported for their decision to retire was that it was financially possible. These findings reinforce the notion that (especially for older plaintiffs), a person’s financial ability to retire should be considered when estimating when that person would have retired, but for the accident.

Comment

The two articles discussed above provide additional support for our common practice of assuming that a plaintiff with substantial residual deficits will likely retire earlier than she would have in the absence of the accident. The articles also identified some factors to be considered when making an assumption concerning a plaintiff’s without-accident retirement age. However, while we know that poor health tends to hasten retirement, we will continue to face the difficulty of knowing the specific effect on a particular plaintiff. That is, for most cases it will remain unclear whether it is more reasonable to assume that a plaintiff’s injuries will cause her to retire (say) three years early or two years. We are left with offering assumptions that are reasonable, providing multiple scenarios, and ultimately leaving it up to the Court to make a specific finding.

References

1. Park, Jungwee. 2010. “Health factors and early retirement among older workers.” Perspectives on Labour and Income. June 2010. Statistics Canada Catalogue no. 75-001-X. p. 5–13.

2. Park, Jungwee. 2011. “Retirement, health and employment among those 55 plus.” Perspectives on Labour and Income. January 2011. Statistics Canada Catalogue no. 75-001-X. p. 1–12.

Footnotes

1. Longitudinal data is collected over a period of time from the same set of people. [back to text]

2. Cross-sectional data is collected from a group of people at one point in time. [back to text]

3. By “not statistically significant”, I mean that the researchers believed that it might have been random chance that caused it to appear as though women with poor health were more likely to exit the labour force than women with excellent health. [back to text]

4. The number of chronic conditions was calculated based on respondents’ answers to questions about whether they had been diagnosed by professionals as having any of the following chronic conditions: asthma, arthritis, osteoporosis, high blood pressure, back problems, migraine headaches, chronic bronchitis, emphysema, chronic obstructive pulmonary disorder (COPD), diabetes, stroke, heart disease, cancer, stomach or intestinal ulcers, urinary incontinence, Alzheimer’s disease or other dementia, bowel disorder/Crohn’s disease or colitis, Parkinson’s disease, thyroid conditions, cataracts, glaucoma, mood disorders, and anxiety disorders. [back to text]

leaf

Derek Aldridge is a consultant with Economica and has a Master of Arts degree (in economics) from the University of Victoria.

Testifying in Singapore

by Derek Aldridge

This article first appeared in the Summer 2009 issue of the Expert Witness.

At the end of February of this year, I testified in a personal injury case in Singapore. I thought our readers would be interested in hearing about my experience.

One of the aspects of the case that made it especially interesting – and challenging – from my point of view is that there are no case-law precedents for the use of economic experts in personal-injury cases in Singapore. In order to accept my evidence, the court would potentially be opening the door to the use of economists or similar experts in future cases. While it is not completely clear to me why there is no history of using economists in Singapore, it appears that the cost of hiring experts is a significant barrier to plaintiffs there. I was advised that for personal injury claims in Singapore, plaintiff lawyers are not allowed to charge any fees until the case is settled. Their ultimate fee is decided by the court and based on what the lawyers submit and the complexity of the case. The lawyers are not allowed to negotiate a contingency fee arrangement. Clearly this imposes a substantial financial barrier for most plaintiffs, since few would have the resources to fund a complex personal injury case in which experts are needed. For the case I worked on, I was hired by the plaintiff side, and the plaintiff did indeed have the financial resources needed to fund the case.

While I will not reveal too many details of the case here, it is sufficient to know that the plaintiff was a young man who was injured at the beginning of a career which would eventually yield a high income. In addition, his father was well-established in the same career, and the son would possibly eventually join in his father’s business. The plaintiff was seriously injured in a motor vehicle accident, but was able to resume his career, albeit with a short delay (less than a year) and with ongoing residual deficits. Due to the nature of his career, if his residual deficits impair his on-the-job productivity, then his income will also be reduced. However, due to the stage he is at in his career, his reduced capacity has not had an appreciable impact on earnings so far. Because of the age of the plaintiff, and his high potential future income without- and with-accident, even a modest ongoing reduction in his annual income would yield a large present value of his future loss.

Liability was already established. The defendant argued that the residual deficits would not impair the plaintiff’s ability to do his job, and his loss was limited to the period of the delay, immediately following the accident. If the plaintiff-side was correct, the loss could be millions, while if the defendant was correct, the loss would be negligible. The case hinged on the medical/vocational evidence (concerning the impact of the plaintiff’s injuries on his job performance) and the economic evidence (concerning the impact of reduced on-the-job performance on his earning capacity).

While personal injury litigation in Singapore has much in common with that that in Canada, one notable difference is that expert witnesses are not used to provide evidence concerning a plaintiff’s loss of income. Instead, the courts rely on tables of multipliers to determine a person’s total loss, given findings concerning the annual loss. This approach can be satisfactory in many cases, but often not in cases when a plaintiff’s income path is expected to experience substantial growth, and/or when a plaintiff’s career paths has been delayed as a result of an injury, and/or when an injury will cause earlier retirement. In the case for which I testified, all of these were factors.

My colleague Laura Weir and I prepared a report for the plaintiff. We never received any written rebuttal responses from the defendant. Arrangements were made for me to travel to Singapore to testify at the end of February, though I expected the case would settle beforehand. It did not, and I made the long journey to Singapore.

I was called to give evidence on a Friday morning. There was no direct examination by the plaintiff’s lawyer – my report was to stand alone as my direct evidence. All questions concerning my evidence were asked by the defence lawyer and the judge. In my case there was no opposing expert evidence, though I presumed that the defence lawyers would be well-briefed by someone who could identify the most important weaknesses in my report. While the defendant was reluctant to have me offer evidence at all, the judge decided that he would hear my evidence and later decide whether or not to use it.

There were several things that were unusual concerning my courtroom experience, compared to my experience with the courts in Alberta. First, the plaintiff was not allowed to be in the courtroom to hear the evidence that I gave. While I testified, the only occupants of the courtroom were myself, two lawyers for the plaintiff, two for the defendant, and the judge. And it was the judge himself who maintained the written “transcript” of the proceedings. He typed at his computer, recording a nearly verbatim version of what was said by all of us, and his transcript was displayed in front of each of us on computer monitors. I found this to be helpful, because it provided me with a written version of all questions posed to me, and also enabled me to read back my own responses which helped in deciding whether or not I was satisfied with my response.

Another unusual part of my courtroom experience was the number of questions the judge asked. I think he asked nearly as many questions as the defence lawyer. Some of his questions seemed to be attempts to clarify my evidence, but others were more probing, consistent with what one would expect from opposing counsel. Apparently the extent of his questioning was not typical of the Singapore Courts.

The judge and defence lawyer were also interested in the calculations that were the basis of my evidence. I was advised the day before I testified that the court would ask me to describe my calculations in detail and provide electronic copies. At the end of my first day of testimony I took the court through my calculations. For me, this was probably the most interesting part of my testimony, and being a computer enthusiast, I was in my comfort zone. I sat beside the judge, and using his mouse and keyboard, we went through the calculations together, with the screen output directed to monitors that also appeared in front of plaintiff counsel and defence.

Fortunately, the judge was quite technically oriented and easily followed along with all of my Excel calculations. And also fortunately (for me), the defence lawyer seemed to be less technically inclined and asked few questions. At the end of my first day of testimony (8:00 pm on a Friday!) we distributed electronic copies of the calculations to the lawyers for their review that evening. The next morning (yes, Saturday), we were back in court and no one had any significant questions regarding the calculations.

The second day’s testimony was much shorter than the first – only about four hours with two short breaks – and things continued to go smoothly for me. In total, I testified for about 11 hours, which is far longer than any of my previous efforts.

I returned to Canada and nervously awaited to see if I would be part of a landmark Singapore judgment. Unfortunately, no. After 16 days of hearing (12 days after my evidence), the case settled out of court, shortly before the plaintiff was about to testify. Based on the amount of the settlement, I believe it was a very favourable result for the plaintiff and suggests to me that the defendant believed there was a high probability that my evidence would have been largely accepted. It is possible that the defendant insurers settled in order to avoid the risk that my economic evidence would have been accepted, creating a precedent for allowing similar evidence in future cases.

leaf

Derek Aldridge is a consultant with Economica and has a Master of Arts degree (in economics) from the University of Victoria.

Examination of Expert Witnesses

by Christopher Bruce and Derek Aldridge

This article first appeared in the winter 2008 issue of the Expert Witness.

On October 28 in Edmonton and October 29 in Calgary, Chris Bruce and Derek Aldridge were participants in a Legal Education Society of Alberta panel on examination of expert witnesses. In this note, we offer some recommendations regarding the examination of expert economists. These recommendations are based on our comments during the panel, and the feedback we received.

We divide our advice into pre-testimony and during-testimony periods.

Pre-Testimony

An effective examination is not created days, weeks, or even months before trial, but years. That is because an effective examination begins with a well-constructed expert’s report. In our experience, at least half of the judge’s impression of your expert’s opinion is going to be based on his or her reading of that expert’s report. Our advice, therefore, is that as soon as you receive the first report from your expert, you should try to read it from the perspective of the judge. If you cannot follow the report easily, despite having been immersed in the case, it is not likely that the judge will be able to follow it either.

This is not to say that you should attempt to influence what your expert is going to say. You do, however, have the right to ask your expert to improve how that opinion has been expressed. At this stage, you should particularly be looking for a clear, logical, methodical development of the expert’s argument. Are the facts and assumptions, upon which the opinion has been based, stated clearly? Is there a clear progression from the facts and assumptions to the conclusions? Does the expert employ clear, simple terminology and arguments? Does he or she “tell the reader what he/she is going to say, say it, then tell the reader what has been said?” Too often, we are sent opposing experts’ reports with a request that we please explain what that expert has said. If the lawyer we are working for cannot understand the opposing expert’s report, it is unlikely that the lawyer for whom the report was prepared could understand it either ? and it is also highly unlikely that the judge will understand it.

Be cautious when asking your economist to present scenarios that may not be supportable. For example, suppose your plaintiff had a well-established career and earned a steady income averaging $75,000 per year. Your economist will likely include a scenario in which it is assumed that the $75,000 annual income would have continued, but for the accident. However, your plaintiff might have advised you that earnings of $100,000 would have been available, due to a likely promotion, and you may decide to ask your economist to include such a scenario, with the understanding that supporting evidence (say, from the employer) will be forthcoming. If it turns out that no evidence will be offered in court to support the more-optimistic scenario, it will reflect badly on your expert (and your case) if the judge is unimpressed with scenarios that are presented as “illustrative only” or “at the request of counsel.”

We strongly recommend that you have a meeting with your expert some time in the two or three weeks preceding a trial: to clarify what the expert’s opinion is in detail and to prepare the most effective method of presenting that opinion in court. We feel that there are at least four major advantages to this pre-trial meeting. (i) As most experts are involved in hundreds of actions and may have written the report in this case months, if not years, ago, a pre-trial meeting can ensure that the expert is fully familiar with his/her own report. (ii) As it is common that new information becomes available in the last month or two before the trial, it is important that the expert is made aware of this information. (iii) You and the expert should discuss the most effective techniques for presenting his/her evidence. Are you, for example, going to follow the expert’s report page-by-page? At this stage, it is often useful to try some practice questions on the expert as experts can sometimes find the wording of questions to be confusing. If there are certain points that you especially want your expert to make during his/her testimony, make sure that your expert knows this, and knows what type of question you will ask in order to obtain the desired response. (iv) A review of the file with your expert may provide you with a clearer assessment of the strengths and weaknesses of both your expert’s report and that of the opposing experts, thereby creating a firmer basis on which to negotiate a settlement.

It is often also important to meet with your expert during the trial, a day or two before his/her testimony. As the lay witnesses appear before the experts, it is important that your expert be informed about any new information that has been presented during the lay testimony. Also, since the economist typically follows most (if not all) of the other experts, your economist can be advised of what evidence was ultimately offered by some of the other experts who prepared reports that were used as a foundation for the economist’s evidence. For example, if the vocational expert’s evidence has changed slightly from that offered in his 218 report (based on new information offered by lay witnesses during trial perhaps), it is important for your economist to know about this. Finally, the expert can be informed concerning the general approach that has been taken by both the opposing counsel and by the judge.

In the weeks or days before testimony, it is important to discuss with your expert the counter-arguments that you and he/she expect will be raised by the other side. While rebuttal reports may been prepared already, it is useful to try to identify what will be the most contentious economic issues, and what your expert’s response will be. Discuss any weaknesses in your expert’s report, and how they might be dealt with in court.

During-Testimony

Unless you have a particularly poorly-qualified expert, you should always begin the expert’s testimony by reviewing his/her qualifications, to impress the judge with the expertise of your witness. If you have a particularly well-qualified expert, opposing counsel may attempt to preclude you from introducing these qualifications by announcing that he/she will accept the expert’s qualifications without a review of the c.v. It is not advisable, of course, to succumb to this tactic.

Before beginning a review of the expert’s qualifications, it is advisable to inform the judge what that individual’s area of expertise is, so the judge can contrast the expert’s qualifications with the expertise that you are claiming.

Do not simply ask the expert to describe his/her c.v. Some experts will be too modest to provide a full description ? and some will be too boastful. Rather, ask them a series of questions about specific aspects of their expertise ? for example, about their most important educational attainments, their professional experience, their most important publications, and their experience testifying.

Enter the expert’s report and base your examination on the report. As the judge will not have expertise in the expert’s area, it will be useful for the judge to have the report before him/her as an aid to understanding the testimony. Also, as the judge will need to read the report later, when preparing a decision, it will be useful to be able to relate the recorded testimony to the report.

Follow the report page-by-page, if not paragraph-by-paragraph or line-by-line in your questioning of the expert. Our experience is that judges find it useful to follow the report during the testimony. If you start jumping around from page to page, the judge will become frustrated.

Ask questions that require only short answers. The court’s attention is held better that way than by allowing the expert to ramble on, perhaps becoming embroiled in the language of his/her discipline.

If you are representing the plaintiff and you think opposing counsel is going to introduce his/her own expert to counter yours, it may be advisable to ask your expert to comment on the opposing expert’s arguments. Your expert may be in a better position to expose the weaknesses of those arguments than you will be in cross-examination.

Similarly, you should also attempt to anticipate the tack that opposing counsel will use in cross-examination of your witness and ask your expert to comment on the anticipated arguments. Your expert will be much more comfortable “arguing” with you than with your opponent, both because cross-examiners will often severely curtail any attempt by experts to raise counter-arguments and because most experts will be reluctant to appear argumentative (with cross-examiners) as it makes them appear biased.

Sometimes during cross-examination, your expert may concede a weakness or error in his/her report. If the other lawyer does not allow your expert ample opportunity to discuss the significance of this weakness/error, then it may be helpful for you to raise the issue during redirect. This will provide your expert with additional time to think about the issue, and to provide a more in-depth response, if one is required.

Conclusion

In summary, a successful examination of your expert economist begins with a well-written report, containing scenarios and assumptions that match the evidence that will ultimately be offered in court. Regardless of your expert’s prior trial experience, it is always useful to meet with him or her before trial to discuss the economic evidence that will be offered, prepare for the other side’s arguments, and advise him/her of relevant testimony by other witnesses. With a suitable foundation and preparation before trial, your expert will have the best opportunity to perform well during trial.

leaf

Christopher Bruce is the President of Economica and a Professor of Economics at the University of Calgary.

Derek Aldridge is a consultant with Economica and has a Master of Arts degree (in economics) from the University of Victoria.

The Discount Rate Revisited (Spring 2008)

by Laura Weir, Derek Aldridge, Kelly Rathje, and Christopher Bruce

This article first appeared in the spring 2008 issue of the Expert Witness.

Our readers will recall that every year or two we review our standard discount rate assumptions and publish our findings. It is time to repeat this exercise.

In the Summer 2006 issue of the Expert Witness, we reported that real rates of interest (that is, the rates of return net of inflation) had increased slightly from those outlined in our Summer 2005 article. We responded by increasing our forecast of the short-term (one to six years) real rates of interest. Our forecasted interest rates for the medium to long-term (seven to 15 years or more) remained unchanged – although these rates were slightly higher than the observed real rates of return on Government of Canada bonds, long-term real rate of return bonds, and the long-term rate mandated in Ontario. (Higher rates lead to lower present values, so our estimates can be considered conservative.)

In our 2006 article we specified our assumptions for real interest rates for periods ranging from one-year to 15 years or more. Our assumptions were based on the observed rates of interest on Government of Canada bonds of various terms. We now have more rates to observe and we see that these rates have continued their long-term downward trend. Real rates of interest for five bond series over the last 14 years are depicted in the figure below (with the rates for 2008 estimated using an average of the January through June interest rates).

Figure 1

From the figure we see that real rates have decreased slightly from their 2006 and 2007 levels. However, the decrease in real interest rates is not sufficient to warrant a change in our discount rate assumptions. In particular, we note that the average real rates for the past 12 and 24 months are very similar to the corresponding averages at the time we wrote the previous article. One exception is the long-term rate, whose 24-month average (2.23 percent) is a third of a percent less than the corresponding 24-month average at the time of our previous article.

Although we do not show the comparable interest rates on guaranteed investment certificates (GICs), we have examined them and they are consistently lower than the rates of return on bonds. For example, the rate currently offered for 5-year GICs is approximately three percent, corresponding to a real rate of only one percent.

Our discount rate assumptions, unchanged from our 2006 article, are shown in the table below.

Table 1

Over the years, our approach to forecasting an appropriate discount rate has been criticized by other economists who prefer to rely on historical interest rates in making their forecasts. Below, we address some of these critiques and provide support for our approach.

Our approach, often called the “conservative investment” approach (which assumes a plaintiff will use his damage award to purchase a financial instrument with an appropriate term to maturity and hold that instrument to maturity), has been criticized by other economists who argue for a “market-based” approach (that assumes a plaintiff will buy and sell bonds as interest rates vary instead of holding the bond to maturity). One of us (Bruce) addressed this issue in an article written for the Spring 2007 issue of the Expert Witness entitled “Forecasting the long-term interest rate on Government of Canada bonds: “market-based” versus “conservative” investment“. We summarize his conclusions here as this issue continues to arise.

Some economists suggest that our approach ignores the price changes resulting from changes in the interest rate within the bond market, arguing for the market-based approach that assumes the plaintiff can earn a higher rate of return by actively buying and selling bonds as interest rates change. As a simple example, suppose a plaintiff will incur a loss of income of $100,000, 20 years from now. The conservative approach assumes that he will purchase a 20-year bond, paying five percent in interest per year, for $37,689 and redeem it at maturity for $100,000 to fund his loss in that year.

Assume, however, that the interest rate decreases to four percent one year after purchase. The market-based approach suggests that at four percent, the plaintiff could sell his bond (that has 19 years left to maturity) for $47,464 (= $100,000/1.0419) and earn $9,775 (= $47,464 – $37,689) in profit, for an effective rate of return of 25.94 percent in one year. However, this is actually not a profit because the plaintiff still has to purchase a 19-year bond (at a cost of $47,464) to fund his $100,000 loss of income 19 years from now. Thus, there is no real benefit to actively trading bonds as the interest rate changes.

In addition to the fact that the effective rates of return under the market-based approach are illusory, effective rates of interest are extremely variable. For example, a publication by the Canadian Institute of Actuaries entitled Report on Canadian Economic Statistics 1924-2005 indicates that the 10-year average (1996-2005) effective real rate of return on long-term Government of Canada bonds was 7.36 percent. However, the standard deviation was 9.01 percent, suggesting an average effective real rate of return that could fluctuate between -1.65 percent and 16.37 percent. This suggests that the plaintiff will almost certainly earn a rate of return different from the average long-term rate. Further, while a “profit” can be made by selling a bond when the interest rate decreases, a “loss” would occur if the interest rate increased (say) to six percent, where the 19-year bond would now only cost $33,051, for a net loss of $4,638 (or an effective rate of return of -12.31 percent).

Finally, if we were to rely on an average of past effective rates of interest then what period should we rely on? For example, the Canadian Institute of Actuaries report noted above indicates that the real effective rate of return on Government of Canada long-term bonds averaged -1.31 percent for the period 1956-1980, +8.74 percent for the period 1981-2005, and +6.79 percent for the period 2001-2005. There would be no justification for relying on any one of the above periods over the others, or for averaging these periods together, in attempting to obtain a forecast of the rate of return in the future.

We use the observed rates on government bonds as an indicator of the rates that are anticipated by large institutional investors, with billions of dollars at stake. While one might find that a forecaster is suggesting that (say) 3½ percent is the appropriate real long-term rate, this prediction is contradicted by the fact that the Government of Canada is presently able to sell its long-term bonds which offer a real return of less than three percent. (If expert institutional investors anticipated that real rates on secure investments will average, say 3½ percent over the next ten years, then they would not buy bonds that pay only 2½ percent, and the Government of Canada would be forced to adjust its bond rates.)

Other economists suggest that it would be simpler to assume that a plaintiff will hold a long-term security and then liquidate portions of this security to fund his/her losses in each year. This is simply another version of the market-based approach and, as discussed, there is a great amount of risk inherent in this strategy. Under our approach, if a plaintiff purchases a 5-year government bond with a value at maturity of $10,000, then in five years he is virtually guaranteed to receive $10,000 after redeeming his bond. However, if he were to buy a 20-year bond with the idea that he would liquidate portions of it to fund losses in each year, then he would be at the mercy of the bond prices available in each year. That is, he would be selling portions of his bond (as opposed to redeeming bonds for the guaranteed maturity value) and so, would be relying on the price of bonds attainable at the date he needed to fund his losses. As our discussion regarding the “conservative” versus “market-based” approaches illustrates, a plaintiff trying to fund his losses during periods of high interest rates would likely be selling portions of his bond at prices lower than his original purchase price and so, may not be able to fund his losses in each future year. If there is pressure on interest rates to increase in the next few years, as many economists feel is the case, then it is likely that plaintiffs investing awards from trials occurring in the next year or two would find themselves in this situation. We do not believe it is reasonable to impose this level of risk on a plaintiff.

Over the last ten years our prediction concerning the long-term interest rate has gradually declined from 4¼ percent to three percent. This decline has been in step with the observed rates, which can be seen in the above chart. Other economists have commented on our changes, with the implication that these changes demonstrate a weakness in our methodology. Our response is that the long-term rate has been changing over the past ten years, and it is important to reflect these changes in our calculations. To do otherwise would result in us using interest rates that are inconsistent with the rates that are actually available to plaintiffs.

Even if one finds that over the past few decades, long-term real interest rates have averaged 3½ percent, that rate is not now available to plaintiffs. Today’s plaintiff seeking secure investments simply cannot obtain a guaranteed long-term rate as high as the rates that were available 10 or 20 years ago. Even if the long-term rate rises to 3½ percent in five years, it does not follow that today’s plaintiff will be able to earn a long-term rate of 3½ percent, since he will be limited to the lower rates for the first five years.

Finally, many economists argue that plaintiffs should invest in equities, as well as bonds, and argue that this would result in a portfolio that is less volatile than investing in bonds alone. We find it difficult to justify the assertion that a portfolio that includes equities would be less volatile, given that the value at maturity of Government of Canada bonds is virtually guaranteed. Remember, the purpose behind the plaintiff’s investment of an award is to fund his losses in each future year and this is much different from investing for (say) retirement. The plaintiff must be able to fund his future losses in each year, whereas retirement can be delayed (or retirement plans changed) if there are insufficient funds. A plaintiff who invests in a series of bonds that provide the amount needed to fund his loss in each year, will receive the necessary amount with little to no risk of default. The same can not be said of equities, which carry a very real risk of default. The inclusion of equities can only increase the risk that a plaintiff will not be able to fund their future losses in each year.

We will re-examine our assumptions next year, and expect that some minor adjustments in our shorter-term rates may be warranted, depending on the movement of rates between now and then. As noted, minor changes in our assumptions regarding short-term interest rates will typically lead to negligible changes to our present value estimates. The assumed longer-term rates have a greater influence on our calculations, and if the rate on long-term bonds remains significantly below three percent (as it has since 2004), it may be appropriate to adjust our long-term rates as well.

leaf

Laura Weir, Derek Aldridge, Kelly Rathje, and Christopher Bruce are consultants with Economica.

Using the HALS/PALS data sets to estimate a loss of income

by Derek Aldridge

This article first appeared in the spring 2007 issue of the Expert Witness.

Many of our readers will have heard of Statistics Canada’s “HALS” and “PALS” disability statistics. These result from surveys that collected data concerning Canadians with disabilities and the manner in which their everyday lives are affected by these disabilities. The HALS statistics are from Statistics Canada’s 1991 Health and Activity Limitation Survey and the PALS statistics are from the 2001 Participation and Activity Limitation Survey.

Of particular interest to our readers is how these statistics can be used to predict the economic impact that a particular disability will have on a specific plaintiff. I have been asked numerous times by plaintiff’s lawyers if it is possible to use the HALS statistics to help determine their client’s loss. In addition, I have been asked by defence lawyers to rebut the claims of other economists who have used this approach. In this article I will discuss the difficulty of using the HALS/PALS approach to estimate a plaintiff’s loss of income. Before offering my comments concerning these statistics, I will provide some background information on the data sets.

In the 1991 and 2001 censuses, recipients of the long-form census forms were asked a few questions designed to determine whether or not they were disabled in a way that limited their activities at home, at work, or at school. Some of those who indicated a disability were subsequently interviewed for a detailed disability survey (a “post-censal” survey). Following the 1991 census, approximately 35,000 adults from the “disabled” census group were selected for the detailed HALS survey. (For technical reasons that do not need to be discussed here, a larger number from the “non-disabled” census group were also selected for the follow-up survey.) Following the 2001 census, approximately 35,000 adults and 8,000 children from the “disabled” census group were selected for the detailed PALS survey.

The 1991 HALS survey identified six types of activity limitation among the adults surveyed: hearing, seeing, speech, mobility, agility, and other (a grouping of non-physical disabilities related to psychological conditions, learning, memory, and so forth). The 2001 PALS survey identified ten types of limitation: hearing, seeing, speech, mobility, agility, learning, developmental disability or disorder, psychological, memory limitation, and chronic pain. Individuals were asked questions to determine the degree of their disability and based on the answers to these questions, their level of disability was assigned a severity scale. In 1991 there were three severity levels: mild, moderate, and severe. In 2001 the severity levels (except for children under five) were mild, moderate, severe, and very severe. The classification examples below are from the Statistics Canada Publication A Profile of Disability in Canada, 2001 (Catalogue 89-577-XIE):

For example, a person who has no difficulty walking and
climbing stairs but cannot stand in line for more than 20
minutes, would have a mild mobility-related disability. A
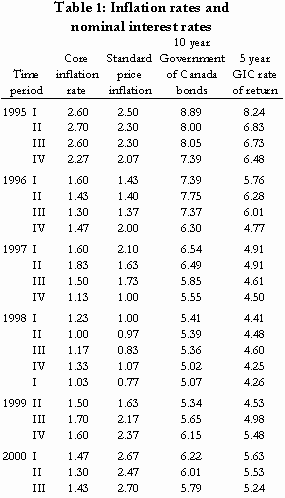
person who can only move around in a wheelchair would have
their mobility more severely limited, and one who is
bedridden for a long term period would have a very severe
mobility-related disability. The number of disabilities also
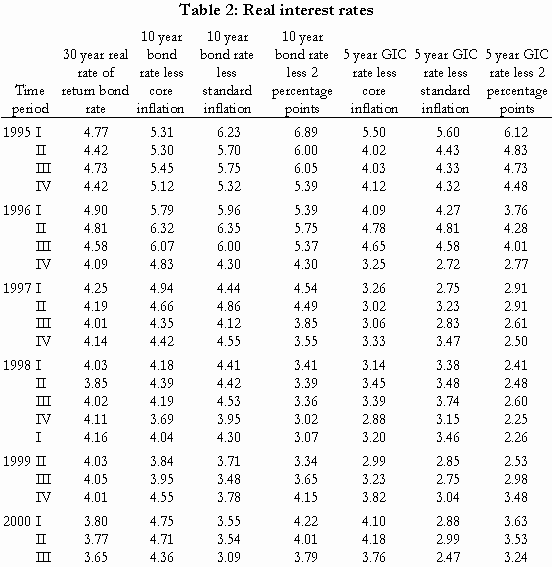
has an impact on the overall level of severity. The PALS
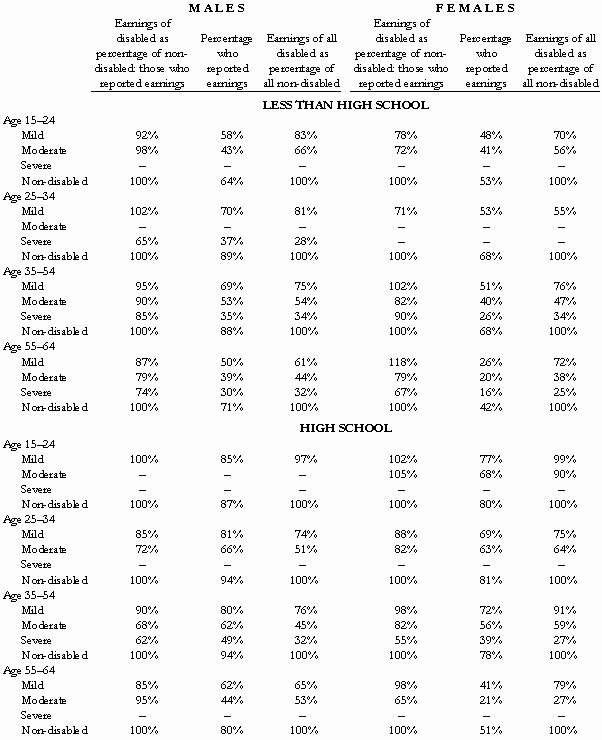
distinguishes 10 types of disabilities among adults and the
level of severity will increase with the number of
disabilities affecting each individual. [Pages
19-20]

In addition to questioning individuals about their limitations, PALS also asked about the cause of disability (e.g., a motor vehicle accident), the age at which the activity limitations began, the level of education, the number of hours worked per week, the reason for working fewer than 30 hours per week, the person’s occupation and industry, the rate of pay, the amount of unemployment experienced in the past year, and numerous other questions. The PALS questionnaire and reporting guide is 86 pages long.

As a result of these surveys, there is a wealth of information available concerning people with disabilities in Canada. Some examples follow, again taken from the publication A Profile of Disability in Canada, 2001:

  • Mobility problems are the type of disability most often
    reported by adults aged 15 and over. In 2001, nearly 2.5
    million or 10.5 percent of Canadians had difficulty walking,
    climbing stairs, carrying an object for a short distance,
    standing in line for 20 minutes or moving about from one room
    to another.
  • More than 10 percent of adults have activity limitations
    related to pain or discomfort.
  • The prevalence of most types of disabilities increases
    with age.
  • A large majority of persons with disabilities aged 15 and
    over have more than one disability.
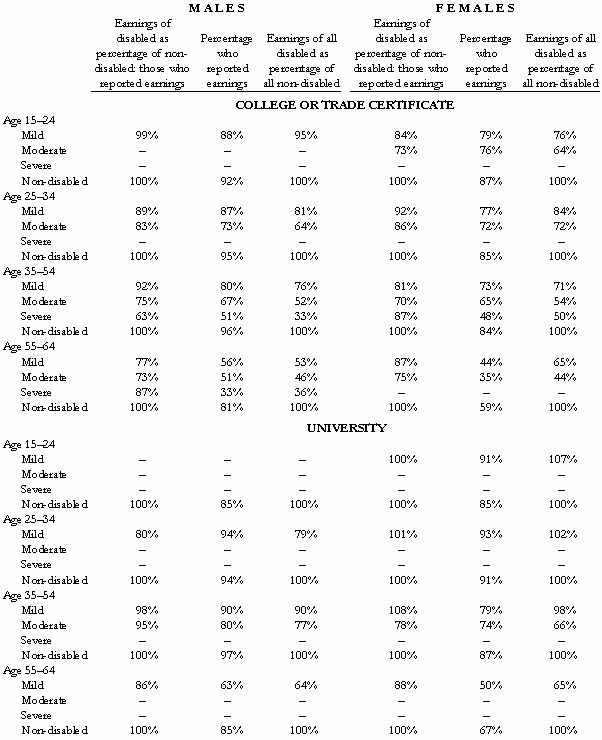
  • Nearly 6 percent of Canadians aged 15 and over have a
    severe or very severe disability.
  • 7.5 percent of all working-age persons are limited in
    their activities due to pain or discomfort.

This is all very interesting, and surely the survey results have many useful applications. However, for our purposes, we want to know how these surveys can be used to help estimate a specific person’s loss of income as a result of an injury. A statistical (econometric) analysis of the data could tell us (for example) how the annual income of an average “severely disabled” male differs from that of males overall. Even better, we might be able to compare the incomes of male journeyman welders age 30-40 who are experiencing severe pain and agility disabilities, with the corresponding average for those who are not disabled. (Or with the corresponding overall average that includes mostly people who are not disabled, and some who are.) Note however, that we have a problem in that as we get more and more specific with respect the category of disabled people, we have less and less confidence in the accuracy of the reported averages. This is because as we get more specific, our sample size gets smaller and smaller and the characteristics of the sample become heavily influenced by the characteristics of a few individuals. I think we could be reasonably confident in our claims about the earnings of severely disabled males relative to males overall, but not very confident at all about my hypothetical welders.

For now let us ignore the technical problems that might arise, and suppose that we are able to construct a statistical model with the HALS data and use it to estimate with confidence, the average earnings of full-time employed severely disabled males aged 30-40 with high school diplomas. Suppose we find that they earn 25 percent less than the overall average for full-time employed males aged 30-40 with high school diplomas. How can we use this information when we come upon a 35-year-old plaintiff who is a high school graduate and has residual deficits that can be categorised as severe? Suppose the plaintiff is working as a full-time truck driver, and we determine that he is earning about 25 percent less than the average for truck drivers his age (consistent with the HALS prediction). Perhaps we can now conclude that the HALS approach does a fine job of predicting his loss of income, assume that the 25 percent loss will continue until retirement, calculate the present value, and move on to the next case.

This conclusion might be reasonable, but what if it is found that the plaintiff can improve his income by retraining and changing occupations? What if it is found that his condition will improve (or worsen) in the future? What if we find that he was already earning a below-average income before he was injured? My point here is that while it is useful to consider the average impact of disability, it is more important to examine the specific plaintiff at hand and investigate how his injuries are affecting his employability and his income. With respect to these issues, the advice of a vocational expert can often be especially helpful.

It is important to recognise the meaning of my (hypothetical) 25 percent reduction estimate, and its limitations. I proposed that the evidence might support a conclusion that full-time employed severely disabled 30-40 year-old males with high school diplomas earn 25 percent less than their non-disabled counterparts on average. In other words, if we randomly selected from the population a person in this category, we would predict that his income will be 25 percent less than the average for his non-disabled counterparts. However, once we can more closely examine the randomly chosen person, we learn more information about him and we may need to revise our prediction.

For example, suppose he has a severe mobility disability but he is also a professional writer. In this case we might have to revise our prediction since his earnings as a writer are probably only slightly affected by his poor mobility. What if we learned that he had been a professional hockey player but had to leave that occupation and is now working in sales? In this case we would also revise our prediction since his earnings reduction is likely much more than 25 percent. It should be clear that as soon as we are considering a particular individual, and not some unknown “randomly selected” person, we need to try to incorporate the additional information we have about that person, and if our HALS estimates are no longer sensible, they should be discarded. This principle is the same as would apply if we wanted to predict the income of a full-time 45-year-old female teacher who is at the top of the salary grid with the Calgary Board of Education. It would be foolish to rely on census data for female teachers instead of simply consulting the appropriate salary grid.

In most cases, it is not even necessary to concern ourselves with the predictions of a HALS model. If a plaintiff was a well-established welder and now he is unemployable due to an injury, HALS adds nothing to the estimate of his economic loss. However, suppose we have an individual whose disabilities are categorised as severe, but he continues to work in his pre-accident job and is not currently experiencing a loss of income. Might this be an occasion when the HALS approach is especially useful in estimating his loss of income, due to the uncertainty regarding how his injuries will affect his future earnings? Probably not. To begin with, the fact that the plaintiff is not currently experiencing a loss of income suggests that he is unlike the average HALS individual. It is an awkward but unavoidable fact that a statistical model will not do a good job of predicting outcomes for “outliers”. That is, if we create a predictive statistical model using a certain sample group, the model’s predictive power diminishes if the subject under consideration is very much unlike the average member of the sample group. But let us ignore this problem for now.

Perhaps we could assume that, in the future he will be more like the average and will experience that 25 percent loss, on average over the remainder of his work-life. This immediately leads to a logical problem that should give plaintiff lawyers pause before relying on such an assumption. If one wants to argue that a plaintiff who is not now experiencing a loss of income will become just like the HALS average in the future, then what of the plaintiff who is now experiencing a loss of income greater than the predicted 25 percent? The reasoning above suggests we should assume that his earnings will improve to only a 25 percent loss, on average, over the remainder of his work-life. This reasoning is, of course, faulty. When we observe a person experiencing less than the expected income reduction, the reasonable conclusion is that he is one of the individuals whose disability has a relatively mild effect on his earnings. The conclusion is not that his earnings gap will widen in the future, as this effectively ignores the additional information conveyed by the his current income. Parallel reasoning applies when we have a person experiencing a greater than expected income reduction.

To be clear, it could be the case that the working plaintiff who is not currently experiencing a loss of income will indeed experience one in the future. However, I do not believe that the loss will be supportable using HALS alone. In such a case, the HALS data would tell us that the individual is currently performing better than his disabled peers (on average), but we still need more evidence to find that he will have a future loss. That evidence may be available from medical experts, vocational experts, or the plaintiff’s employer. Perhaps there is evidence that the plaintiff faces a greater chance of future unemployment, or is likely to retire early due to his residual deficits. These factors will lead to a loss of income and they can be explicitly incorporated in our calculations – there is no need to appeal to HALS averages. Alternatively, it may be the case that the plaintiff is not now experiencing a loss of income because the injuries are not affecting his ability to earn income and never will. In that case we might be left with a “loss of capacity” argument, which I will not address here.

To summarise, I believe that in most cases when we have an adult plaintiff, the HALS approach is not going to be especially useful in determining his loss of income. It simply provides a useful baseline to compare a particular plaintiff to his disabled peers, in the same way that census income averages tell us how a particular 45-year-old female teacher’s earnings compare to her same-age peers.

There are cases in which I think the HALS approach could be useful, and these are when we know very little about how a disability will affect a person’s employment and earnings. For example, in the case of a child who is injured, we could use HALS to predict the impact on her future earnings. Even in such circumstances, the HALS approach would still be limited in at least two ways. First, the HALS approach will only be valid if the child’s expected educational attainment is unaffected by the injuries. Second, in such a case we would also need a HALS model that can be restricted to those adults who were injured when they were children, since there will certainly be a difference in the impact of (say) a severe mobility disability on earnings if the person is injured at age 10 versus if she is injured at age 40. This restriction will add to the sample size problems I noted above. For an injured adult the HALS approach could be useful if there remains a great deal of uncertainty regarding how her earnings will be affected. For example, in the case of a plaintiff who has been out of the labour force for many years (due to parenting responsibilities perhaps) and who has not yet attempted to re-enter the labour force.

In these cases however, like all others, we must remain willing to discard the HALS averages if we have better information about how the plaintiff’s income will be affected. It is not satisfactory to say that because the loss of income is difficult to determine, HALS will yield our best estimate. In most cases we can do better, because we are not predicting the income of a randomly selected disabled individual. Instead we are predicting the income (and loss) of a specific individual about whom we know a great deal. The fact that we have a HALS model at our disposal does not mean that we should ignore the facts of our specific plaintiff.

leaf

Derek Aldridge is a consultant with Economica and has a Master of Arts degree (in economics) from the University of Victoria.

The Discount Rate Revisited (Summer 2006)

by Derek Aldridge

This article first appeared in the summer 2006 issue of the Expert Witness.

Our readers will recall that every year or two we review our standard discount rate assumption and publish our findings. It is time to repeat this exercise.

One year ago, in the Summer 2005 issue of the Expert Witness, we reported that real rates of interest (that is, the rate of return net of inflation) had continued their downward trend. We responded by lowering our forecast of the long-term real rate of interest to three percent – a rate that was slightly higher than the observed real rate of return on long-term Government of Canada bonds, long-term real rate of return bonds, and the long-term rate mandated in Ontario. (Higher rates lead to lower present values, so our estimates can be considered conservative.)

In addition, we made a change to how we applied our discount rate assumptions in our calculations. Previously we had assumed that the plaintiff’s entire lump sum award would earn a given interest rate, regardless of the fact that part of the award might be needed to fund next year’s losses and another part might be needed to fund losses 20 years from now. Our revised approach was to assume that the plaintiff will invest part of his award in short-term investments, part in medium-term investments, part in long-term investments, and so forth. This more accurately reflects the behaviour that would be expected from a plaintiff, and it more accurately reflects the different returns he can expect from his short-term investments versus his long-term investments. [*]

In our previous article we specified our assumptions for real interest rates for periods ranging from one-year to investments of 15 years or more. Our assumptions were based on the observed rates of interest on Government of Canada bonds of various terms. We now have four more quarters of rates to observe and we see that, except for the returns on long-term bonds, rates have increased. The trend in real rates over the last ten years is depicted in the chart below.

Figure 1

Note that to determine the real interest rate we deduct two percentage points from the “nominal” or observed interest rates to reflect inflation anticipated by investors. As the Bank of Canada has managed to keep the core rate of inflation within a small band around this target since the early 1990s, and as it has been the stated intention of not only the Bank of Canada but most other central banks (most notably that of the European Union) to keep the inflation rate at that level, there is now virtual unanimity among investors that two percent will be the long run rate of inflation in Canada. Accordingly, it can be concluded that investors have been acting as if the real rate of interest is the observed, nominal rate less two percent.

From the chart we see that most real rates began to rise with the third quarter of 2005. Long-term government bonds did not begin their rise until the second quarter of 2006 and are now only slightly higher than they were a year ago. The pattern has been similar for real rate of return bonds. Given these changes, we believe a slight increase in our shorter-term rates is warranted, though we will not change our longer-term rates. The most recent two years of real rates are shown in the table below, along with the rates that we will use in our calculations.

Table 1

The change from the rates we have been using for the past year is very modest. Only the rates for years 1-6 have changed at all, and these changes will have a negligible impact on our calculations. The present value of losses that will end within five years will decrease by about one percent relative to our previous assumption, while losses that extend for more than five years will fall by an even smaller amount.

Although we do not show the comparable interest rates on guaranteed investment certificates (GICs), we have examined them and they are consistently lower that the rates of return on bonds. For example, the real rates on 1-year GICs are currently about one percent, while the real rate on 5-year GICs is only about 1½ percent.

Note that we are not specifically assuming that plaintiffs will invest their awards in government bonds and hold them to maturity. There are a variety of reasonable investment strategies they could pursue. We use the observed rates on government bonds as an indicator of the rates that are anticipated by large institutional investors, with billions of dollars at stake. While one might find that a forecaster is suggesting that (say) 3½ percent is the appropriate real long-term rate, this prediction is contradicted by the fact that the Government of Canada is presently able to sell its long-term bonds which offer a real return of less than three percent. (If expert institutional investors anticipated that real rates on secure investments will average, say 3½ percent over the next ten years, then they would not buy bonds that pay only 2½ percent, and the Government of Canada would be forced to adjust its bond rates.)

Over the last ten years our assumption regarding the long-term interest rate has gradually declined from 4¼ percent to three percent. This decline has been in step with the observed rates, which can be seen in the above chart. Other economists have commented on our changes, with the implication that these changes demonstrate a weakness in our methodology. Our response is that the long-term rate has been changing over the past ten years, and it is important to reflect these changes in our calculations. To do otherwise would result in us using interest rates that are inconsistent with the rates that are actually available to plaintiffs.

Even if one finds that over the past few decades, long-term real interest rates have averaged 3½ percent, that rate is not now available to plaintiffs. Today’s plaintiff seeking secure investments simply cannot obtain a guaranteed long-term rate as high as the rates that were available 10 or 20 years ago. Even if the long-term rate rises to 3½ percent in five years, it does not follow that today’s plaintiff will be able to earn a long-term rate of 3½ percent, since he will be limited to the lower rates for the first five years.

As noted, we have changed our assumptions regarding the shorter-term discount rates, but not the longer-term rates. We expect that our estimates of the long-term rate discount rate will change less frequently and to a lesser extent than our estimates of the shorter term rates. This simply reflects that shorter-term rates are inherently more volatile than long-term rates. This can be seen in these charts (Figure 2), which show the percentage point changes in the quarterly real interest rates over the last ten years.

Figure 2

We will re-examine our assumptions next year, and expect that some minor adjustments in our shorter-term rates may be warranted, depending on the movement of rates between now and then. As noted, minor changes in our assumptions regarding short-term interest rates will typically lead to negligible changes to our present value estimates. The assumed longer-term rates have a greater influence on our calculations, and if the rate on long-term bonds remains significantly below three percent (as it has since 2004), it may be appropriate to adjust our long-term rates as well.

Footnotes

* To illustrate the effect of this approach, note that a child plaintiff who will not experience a loss of income for ten years will manage to earn a relatively high rate of return because he will be able to invest in “long-term” investments, and he will be more likely to benefit from possible future increases in interest rates. On the other hand, an older plaintiff who will experience a loss of income over the next five years only, will not be able to benefit from long-term investments or from possible increases in interest rates. She will face the low rates available on short-term investments. [back to text of article]

leaf

Derek Aldridge is a consultant with Economica and has a Master of Arts degree (in economics) from the University of Victoria.

Estimating the Impact of Mid-Career Retraining

by Christopher Bruce and Derek Aldridge

This article first appeared in the summer 2005 issue of the Expert Witness.

Vocational psychologists commonly recommend that injured plaintiffs retrain for a new occupation. A problem that this creates for the financial expert is that it is not clear what the individual’s starting wage will be once the training period has been completed.

Specifically, all of our data concerning incomes by occupation suggest that individuals’ incomes increase as they age (usually until their mid-40s). If we assume that this increase occurs either because individuals gain valuable experience in their occupations or because they move up “career ladders” as they age, individuals who change careers will find themselves starting at lower wages than would be suggested by their ages.

For example, Table 1 reports incomes by age (for Alberta males) for two occupations that are commonly recommended as retraining possibilities: partsman (NOC-S B572) and drafting technologist/technician (NOC-S C153). It can be seen there that annual incomes rise continuously from the youngest age group, 20-25, to the second oldest group, 45-54, before declining slightly.

Table 1

If it has been recommended that, say, a 40 year-old male retrain to enter one of these occupations, the economic expert is faced with determining which of the income levels from Table 1 best represents the income at which the plaintiff will begin his new career. If experience in the occupation, or movement along a career ladder, are important determinants of income, then we would expect that the newly-trained worker would begin at one of the lower incomes suggested by the census data.

Perhaps with his greater maturity the 40 year-old would not start at the income level of a 20-25 year-old; but with no experience in this occupation, it seems unlikely that he would start at the income of a 40 year-old. Fortunately, statistical evidence has recently become available that can help us to determine the impact of a change in career.

Most importantly, Arthur Goldsmith and Jonathan Veum[*] have used a detailed survey that followed 1400 young workers from 1979 to 1996 to compare the effects of additional years of experience on wages when individuals: remained in the same occupation and industry, remained in the same occupation but moved between industries, remained in the same industry but changed occupations, and changed both occupations and industries.

What they found was that the value that was placed on previous experience was approximately the same for all individuals except those that had changed both occupation and industry. In their words:

…experience acquired while a real estate agent is
valued similarly as tenure at other occupations, such as
accounting, within the real estate industry. In addition, the
experience as a real estate agent is valued similarly to
tenure at other industries, such as the pharmaceutical
industry, if continuing in the occupation of sales. If the
real estate agent becomes an accountant in the pharmaceutical
industry, however, the experience as a real estate agent is
of less value than that within accounting or the
pharmaceutical industry. (p. 442)

Referring to the examples in Table 1, Goldsmith and Veum’s findings suggest that the 40 year-old who retrains as a partsman may be able to earn an income comparable to that of a 40 year-old partsman with 15 years experience, if the retrained individual remains within his previous industry. For example, if an individual who had previously worked on oil rigs becomes a partsman in a shop that provides equipment to oil rigs, he can be expected to obtain a starting salary much higher than he would have obtained if he had become a partsman in an automobile dealership.

We would suggest that Goldsmith and Veum’s findings be interpreted in the following way: First, if the plaintiff’s injuries require that he/she retrain for both a new occupation and a new industry, the starting salary should (normally) be selected from the 25-29 year-old census category. This allows for the finding that previous experience is of limited importance, while avoiding the confounding effect that the incomes of 20-24 year-olds will be biased downwards by issues of immaturity.

Second, if the plaintiff’s injuries require that he/she retrain for a new occupation in the same industry he/she worked in prior to the accident, it should be assumed that the experience gained in the previous occupation will be, in large part, transferable to the new occupation. This does not necessarily mean that a 40 year-old plaintiff should be assumed to start his/her new career at the income level of an experienced 40 year-old in that occupation. Most importantly, plaintiffs often experience residual mental and physical difficulties that will reduce their earning capacity below that of the individuals represented in the census data. Also, however, it must be recognised that Goldsmith and Veum’s results referred to individuals who had changed occupations voluntarily; that is, to individuals who had chosen new occupations that met both their interests and their aptitudes. Plaintiffs often are not provided with that opportunity. As the new occupations for which they are retraining are not those that they had chosen when they were healthy, it is possible that they will not perform as well as individuals who had chosen those occupations voluntarily.

Finally, it must be recognised that Goldsmith and Veum’s findings are only suggestive. They can only be interpreted to indicate that, on average, when uninjured individuals make mid-career changes within a given occupation or industry, they tend not to suffer appreciable losses of earnings. They provide less information about specific individuals, particularly those who make significant career changes because of injury. We strongly suggest, therefore, that counsel request an opinion from a vocational psychologist concerning the impact that the injuries suffered by the particular plaintiff in question will have on that individual’s earning capacity. Specifically, if the psychologist recommends that the plaintiff retrain for a different occupation or industry, does the psychologist believe that that individual will be able to begin the new career at a salary that is comparable to other individuals of his/her age? Or will the plaintiff be forced to enter the new career at a salary lower than that of otherwise comparable individuals?

Footnotes

* Goldsmith, A.H. and J.R. Veum (2002). Wages and the Composition of Experience. Southern Economic Journal, 69(2), 429-443. [back to text of article]

leaf

Christopher Bruce is the President of Economica and a Professor of Economics at the University of Calgary. He is also the author of Assessment of Personal Injury Damages (Butterworths, 2004).

Derek Aldridge is a consultant with Economica and has a Master of Arts degree (in economics) from the University of Victoria.

The Discount Rate Revisited

by Christopher Bruce, Derek Aldridge, Kelly Rathje, and Hugh Finnigan

This article first appeared in the summer 2005 issue of the Expert Witness.

In the Autumn 2000 issue of this newsletter, we conducted an extensive review of the various methods of measuring the real rate of interest, or discount rate, and presented evidence concerning the movement of those measures over the period 1995-2000. (That article is available on our website, at economica.ca/ew53p1.htm.)

That survey was subsequently updated in our Winter 2001/02 and Spring 2003 issues. What we found in both of those updates was that interest rates had begun to fall relative to the historically high levels that had persisted over most of the 1990s.

At the time of our Spring 2003 article, we concluded that the best estimate of the long-run discount rate was 3¼ percent. But we also argued that, as interest rates on short-term bonds and GICs were lower than those on longer term investments, it would be appropriate to employ an interest rate of 2¼ percent on the first five years of any investment.

The primary purpose of this article is to examine nine additional quarters (27 months) of data to determine whether the trend we observed in our earlier articles has continued, or whether a revision in our recommended interest rate is appropriate. We also report on recent changes to Ontario’s mandated discount rate; and we revisit the question of whether forecasts of future interest rates should be based on information about past interest rates or on information about current, long-run interest rates.

Revised Data

Instead of providing tables of data comparable to those presented in our earlier articles, we now present a chart that shows the trend in interest rates since 1995. The complete data set can be found on our web site (see www.economica.ca/ew102p1.htm). Figure 1 shows the trend in real interest rates on government bonds of various term lengths, as well as the rate of return on real rate of return bonds.

Figure 1

Note: We deduct two percentage points from the “nominal” or observed interest rates to reflect inflation anticipated by investors. As the Bank of Canada has managed to keep the core rate of inflation within a small band around this target since the early 1990s, and as it has been the stated intention of not only the Bank of Canada but most other central banks (most notably that of the European Union) to keep the inflation rate at that level, there is now virtual unanimity among investors that two percent will be the long run rate of inflation in Canada. Accordingly, it can be concluded that investors have been acting as if the real rate of interest is the observed, nominal rate less two percent.

The data in Figure 1 indicate that real rates of interest have continued the downward trend that began in 1996/97. Whereas we concluded two years ago that long-term real interest rates were approximately 3¼ percent and short-term rates approximately 2¼ percent; it now appears that real rates have fallen substantially below those levels. In particular, note that the rate of return on 10-year Government of Canada bonds, net of the 2 percent expected rate of inflation, is now below 2 percent and has not exceeded 3¼ percent (our earlier prediction of the “long-term” rate) since early 2002. Even the real rate on long-term (30-year) Government of Canada bonds has fallen below 2½ percent in the most recent quarter. And the rate of return on real rate of return bonds is now below 2 percent and has not been above 3 percent since mid-2003.

Although we do not show the comparable interest rates on guaranteed investment certificates (GICs), we have examined them and they are consistently lower that the rates of return on bonds. For example, the real rates on 1-year GICs have been consistently negative since late-2001, meaning that investments in one-year GICs are not keeping pace with inflation. The real rate on 5-year GICs has been below one percent for all but two of the last eight quarters and has not exceeded two percent since early 2002.

Forecasting the Real Rate of Interest

For some time now, Economica has been arguing that current interest rates, net of the two percent expected rate of inflation, provide the most reliable basis on which to predict future interest rates. Some other economic experts in Western Canada disagree with us, and base their forecasts on information about historical interest rates. We consider their position to be unjustified. We explain why here:

The continued dramatic fall in interest rates.

First, as a glance at Figure 1 will indicate, the real rate of interest in the last decade has fallen continuously and dramatically: the long-term rate has fallen from about 7 percent to below 2½, while the short-term rate has fallen from about 6 percent to below 1 percent. Clearly, any prediction that was based on an average of the figures in this period (or any other period extending back to the early 1980s) would seriously overstate the rates that will be available to a plaintiff investing his or her award today.

It is important to note that although rates are low by historic standards, today’s investors who seek the security of investments comparable to government bonds and GICs cannot avoid these low rates. The fact that average interest rates over the last 30 years were much higher does not help today’s plaintiff-investor. Even if one believed that long-term real rates will rebound to (say) 3.5 percent in the next 5-10 years, the best that today’s investor will be able to do is place his funds in 5-10 year investments earning 1.5-2 percent and then hopefully reinvest at the higher 3.5 percent rate. This of course will not yield nearly the same result as if he had been able to invest at 3.5 percent right from the start.

Economic theory.

Second, the fall in real interest rates is consistent with macroeconomic theory. Specifically, many macroeconomists are arguing that the relatively high real interest rates that were observed in the 1980s resulted from the high volatility in expectations concerning the nominal rate of inflation. That is, when inflation is unpredictable, investors who place their funds in long-term bonds face a considerable amount of uncertainty. If inflation proves to be higher than expected, the real rate of return that they realise may be very low or even negative. To compensate for this uncertainty, investors demand a relatively high expected rate of return. Conversely, when inflation becomes predictable, as has happened in the last five to ten years, investors face much less uncertainty and are willing to accept lower real rates of return. Accordingly, there is sound reason to believe that, as long as the Bank of Canada maintains its current course[*] (which it is expected to do), both nominal inflation and real interest rates will remain at the low levels that have been observed recently.

Furthermore, most economists believe that real interest rates will be higher in a period in which governments run large deficits – and, therefore, have to borrow heavily – than in those in which revenues exceed expenditures. As is well known, although the Canadian government ran sizeable deficits in the late 1980s and 1990s, it has now adopted a goal of achieving a balanced (or, even, surplus) budget. Again, this leads us to believe that real interest rates will be lower in the future than they were in the 1980s and 1990s.

The actions of large, institutional investors.

Most of the bonds reported in Figure 1 are purchased by large, institutional investors, such as pension funds. That these investors are willing to purchase, say, ten-year bonds paying a real rate of approximately two percent, or real rate of return bonds that are paying below two percent (as of the second quarter of 2005) indicates that they do not anticipate that they can obtain better rates of return on other secure investments. That is, regardless of whether private investors actually purchase the government bonds identified in Figure 1, the returns on those bonds indicate that the institutions that base millions of dollars of investment on their predictions of the financial markets are forecasting that real rates of return will remain low in the foreseeable future. (If expert institutional investors anticipated that rates on secure investments will average, say 3½ percent over the next ten years, then they would not buy bonds that pay only two percent, and the Government of Canada would be forced to adjust its bond rates.)

A future increase in rates will have little effect on most plaintiffs.

Even if real interest rates were to increase substantially in the next ten years or so, (against expectations), that would have relatively little effect on the investments of many plaintiffs, for two reasons. First, it is the rates of return that are available today that will dictate the average rate that plaintiffs will be able to obtain over at least the first 5-10 years of the period of their loss. As noted above, if rates increase in the future, the best that today’s plaintiff can do is place his funds in 5-10 year investments at today’s low rates and then later reinvest at the (hopefully) higher future rates. Even if rates return to their historical average, this investment approach will still yield an average rate of return that is below the historical average. Second, since most plaintiffs will need to begin consuming their award immediately (to replace their lost income and fund their costs of care), the most substantial portion of the interest that they will earn on the investment of their awards will occur in the first half of their period of loss, before they have drawn down much of their capital (that is, during the period in which they are funding most of their annual losses from interest income). If the period of loss is 20 years or less (like most plaintiffs), then the interest they earn in the first ten years will have a much greater impact on their investments than the interest they earn in the next ten years. Thus a return to higher interest rates after 10 years or so will have only a small impact on these plaintiffs. For plaintiffs with a period of loss that is only ten years or less, future increases in interest rates will have almost no effect on their investments.

Note that one implication of relying heavily on current interest rates is that it requires that we change our discount rate assumption more frequently than if we simply relied on historical averages. However, making changes to our discount rate assumption does not imply a weakness in our methodology. To do otherwise would result in us using interest rates that we know are inconsistent with the rates that are actually available to plaintiffs. Even if one believed that over the long-term, real interest rates will average (say) 3 or 3½ percent, it does not necessarily follow that our discount rate assumptions should remain fixed. This is because (as we explained above), the rates of return over the next ten or so years will have a substantial impact on the investment results of most plaintiffs. Thus, it is important to account for the rates that are available to plaintiffs now, as well as the rates that will be available (on average) over the long-term.

Ontario’s mandated discount rate

Following a detailed review, Ontario (in year 2000) revised its regulations concerning its mandated discount rate. The new methodology that was chosen yields a discount rate of 1.5 percent for the first fifteen years of any award and 2.5 percent for all years beyond that point. Specifically, Ontario’s revised regulation 53.09 states:

53.09 (1) The discount rate to be used in determining the amount of an award in respect of future pecuniary damages, to the extent that it reflects the difference between estimated investment and price inflation rates, is,

(a) for the 15-year period that follows the start of the trial, the average of the value for the last Wednesday in each month of the real rate of interest on long-term Government of Canada real return bonds (Series V121808, formerly Series B113911), as published in the Bank of Canada Weekly Financial Statistics for the 12 months ending on August 31 in the year before the year in which the trial begins, less 1 per cent and rounded to the nearest ¼ per cent; and

(b) for any later period covered by the award, 2.5 per cent per year. O. Reg. 488/99, s. 2; O. Reg. 263/03, s. 4 (1).

The average month-end rate of return on real rate of interest bonds from September 2003 through August 2004 was 2.58 percent. Deducting one percentage point and rounding to the nearest quarter percent yields a mandated discount rate of 1.5 percent for trials that occur in 2005. Given the rates on real rate of interest bonds since September 2005, we can also be almost certain that Ontario’s mandated discount rate (for the first 15 years of loss) will fall to 1.0 percent for trials that occur in 2006.

As discussed in an earlier article (see “Ontario’s Mandated Discount Rate – Rule 53.09(1)” that appeared in the Autumn 2000 issue of the Expert Witness), we have a concern with Ontario’s policy of deducting one percentage point from the one-year average of the rate on real rate of return bonds. What is perhaps more interesting is their finding that 2.5 percent reflects the long-term real rate of interest. This rate is lower than the long-term rate we have been using, though it is consistent with the current rate on long-term Government of Canada bonds.

Conclusion

Our review of the empirical and theoretical sources suggests that it would be appropriate to adjust our discount rate assumption. We also propose to make a change in how we apply our discount rate assumptions in our calculations. Whereas we previously assumed that the real rate of return on all of a plaintiff’s investments would be 2.25 percent for the first five years and 3.25 percent thereafter, we now assume that for income required in the first few years, an investment will be made at short-term rates, while for income needed in the more distant future, investments will be made that will earn the predicted long-term rates. Below we will further explain the approach we will use for our calculations, and then we will outline the discount rate assumptions we will use.

To illustrate the effect of this approach, note that a child plaintiff who will not experience a loss of income for ten years will manage to earn a relatively high rate of return because he will be able to invest in “long-term” investments, and he will be more likely to benefit from possible future increases in interest rates. On the other hand, an older plaintiff who will experience a loss of income over the next five years only, will not be able to benefit from long-term investments or from possible increases in interest rates. She will face the low rates available on short-term investments.

Consider the following example of a plaintiff who will incur a loss of income of $10,000 seven years from now. If she is compensated for the future loss today, she could use her award to purchase a government bond with a seven-year term, and not touch the award until it is needed in seven years, when the bond matures. We will see in Table 1 (below) that such a bond has been paying about 2.2 percent, net of inflation over the last two years. This plaintiff will not need to invest at the lower rates offered by shorter-term assets, but she will also not benefit from the rates offered on longer-term bonds, nor will she benefit from a possible future increase in interest rates. To invest her award in secure assets she faces two options: she can make successive short-term investments in hopes that the rates will increase in the near future, or she can make a longer-term (seven-year) investment and accept the interest rate that is available to her. Given her investment-obligations as a plaintiff, we would expect that that latter option would be more appropriate. Even if she chose the former option we would not expect her overall return to improve, unless we knew that rates would increase in the near future. (And if it was known that rates will increase in the near future, then this increase would already be reflected in the current rate of return offered on seven-year bonds.)

For our calculations we will choose an average rate of return that will be earned on investments that are held until each future year of the period of loss. For example, we assume that the portion of the plaintiff’s award that is held for seven years to compensate her for her loss in year 7 will earn an average rate of return of 2.2 percent. Similarly, we assume that the portion of the plaintiff’s award that is held for 15 years to compensate her for her loss in year 15 will earn an average rate of return of 3.0 percent. And so forth.

To obtain the discount rates for use in our calculations, we propose to take an average of the most recent two years of quarterly interest rates (using two years of monthly rates would yield the same results), for the Government of Canada benchmark bond yields for 2-, 3-, 5-, 7-, 10-year, and long-term bonds. After deducting two percentage points for anticipated inflation and rounding to the nearest tenth of a percent, this will give us our assumed real interest rates for various future terms. We assume the one-year rate is the same as the reported two-year rate, and for the “in-between” years we simply extrapolate. We assume that the long-term rate applies to year 15 and beyond. The rates that result from this approach are shown in Table 1.

Table 1

Note that we believe that the rates proposed in Table 1 (above) remain conservative (that is, they may understate future losses) since they reflect interest rates that have been available over the past two years, instead of only the rates that are available now (even though only the rates available now can be assured to today’s investor).

Footnotes

* Since approximately December 1993, the Bank of Canada has successfully maintained a policy of keeping inflation at a two percent target (the midpoint of its 1-3 percent target range). [back to text of article]

leaf

Christopher Bruce is the President of Economica and a Professor of Economics at the University of Calgary. He is also the author of Assessment of Personal Injury Damages (Butterworths, 2004).

Derek Aldridge is a consultant with Economica and has a Master of Arts degree (in economics) from the University of Victoria.

Kelly Rathje is a consultant with Economica and has a Master of Arts degree (in economics) from the University of Calgary.

From 2003 through 2005, Hugh Finnigan was a consulting economist at Economica, with a Master of Arts degree from the University of Calgary.

Selecting the Discount Rate – An Update

by Christopher Bruce, Derek Aldridge, Kelly Rathje, and Scott Beesley

This article first appeared in the spring 2003 issue of the Expert Witness.

In the Autumn 2000 issue of this newsletter, we conducted an extensive review of the various methods of measuring the real rate of interest, or discount rate, and presented evidence concerning the movement of those measures over the period 1995-2000.

That survey was subsequently updated in our Winter 2001/2002 issue (Vol. 6, No. 4). What we found was that interest rates had begun to fall, relative to the historically high levels that had persisted over most of the 1990s.

At that time, we concluded that the best estimate of the long-run discount rate was 3½ percent. But we also argued that, as interest rates on short-term bonds and GICs were lower than those on longer term investments, it would be appropriate to employ an interest rate of 2½ percent on the first five years of any investment.

The purpose of this article will be to provide five additional quarters (15 months) of data to determine whether the trend we observed at the beginning of 2002 has continued, or whether a revision in our recommended interest rate is appropriate.

Revised data

Tables 1 and 2 provide updates of the information contained in the equivalent tables of the Winter 2001/2002 article. In particular, we have added data for all four quarters of 2002 plus the first quarter of 2003.

Table 1 reports the “raw” data from which some of the real interest rate figures in Table 2 have been calculated. The first column reports the “core rate of inflation” – a measure of the rate of inflation that removes the effects of change in those components of the price index that often move erratically, such as food, energy, and taxes. It is often argued that this measure offers a more reliable predictor of future changes in prices than does the “standard” measure of price inflation. (See the Autumn 2000 article for a detailed description of the core rate of inflation.)

The next three columns in Table 1 report the rates of return on Government of Canada 5-year and 10-year bonds and on 5-year Guaranteed Investment Certificates (GICs). The former represent the minimum rates of return that investors can expect on safe investments. The rate of return on GICs, on the other hand, represents the interest rate available on a mixed, low-risk portfolio of stocks and bonds.

Table 1

Table 2 reports seven measures of the real rate of interest – that is, the rate of interest net of the expected rate of inflation. The first of these is the market-determined rate of return on “real rate of return bonds” – bonds whose value is denominated in terms of the real rate of interest. These bonds are of particular importance because they are purchased by sophisticated investors and because they tend to held for long periods of time.

The second, fourth, and sixth columns report the 5- and 10-year government bond interest rates and 5-year GIC rates net of the core inflation measure.

Finally, columns three, five, and seven report the government bond and GIC rates net of the Bank of Canada’s target rate of inflation of 2 percent. As the Bank has managed to keep the core rate of inflation within a small band around this target for the last eight years, it is widely believed that 2 percent is the rate that is expected by most investors. That is, investors are believed to act as if the real rate of interest is the observed, nominal rate less 2 percent.

Table 2

Interpretation of the data

The data in Table 2 indicate that real rates of interest have continued the downward trend that began in 1996/1997. Whereas we concluded a year ago that long-term interest rates were approximately 3½ percent and short-term rates approximately 2½ percent; it appears that those rates have now fallen to 3 percent and 2¼ percent, respectively.

Note that the latter rate is close to the rates reported in the Bank of Canada’s Monetary Policy Report of April 2003 (Chart 19, p. 24).

In addition, 3 percent is the rate at which the Bank of Canada recently issued a new set of 33-year real rate of interest bonds. As we argued in the Autumn 2000 issue of the Expert Witness, the rate of return on these bonds is a particularly reliable estimate of the expected real interest rate as they are purchased primarily by large institutional investors (like pension funds) that have made considerable investments in the prediction of future rates of interest and inflation.

For this reason, we believe that it would be appropriate to revise our existing 2½ and 3½ percent two-part forecast of real interest rates. Based primarily on the observed rate on 5-year Government of Canada bonds, we propose to use a rate of 2¼ percent for the first five years of all calculations. For all subsequent years we propose to use a rate of 3¼ percent – though we note that a rate as low as 3 percent could be supported based on the most recent observed rates on 10-year Government of Canada bonds and based on the Bank of Canada’s current issue of real rate of return bonds. Our long-term rate is perhaps slightly conservative, but we will re-examine this issue next year and decide then if changes are warranted.

leaf

Christopher Bruce is the President of Economica and a Professor of Economics at the University of Calgary. He is also the author of Assessment of Personal Injury Damages (Butterworths, 2004).

Derek Aldridge is a consultant with Economica and has a Master of Arts degree (in economics) from the University of Victoria.

Scott Beesley is a consultant with Economica and has a Master of Arts degree (in economics) from the University of British Columbia.

Kelly Rathje is a consultant with Economica and has a Master of Arts degree (in economics) from the University of Calgary.

Management fees

by Derek Aldridge

This article first appeared in the winter 2002 issue of the Expert Witness.

We occasionally encounter cases in which it is argued that the injured plaintiff requires an additional award to pay for the services of a financial manager (that is a “management fee” award). I have recently been involved in a couple of cases in which I had to consider this issue in detail, and in this article I will share some of my thoughts on the matter.

Typically (in my experience) these cases involve seriously injured plaintiffs (often children) with large loss of income and cost of care claims. It is anticipated that the plaintiff will be unable to manage his own financial affairs, and will therefore need the assistance of a financial advisor. The advisor (most banks and related financial institutions provide these services) will invest the plaintiff’s money, ensure that his bills are paid, prepare his taxes, and so forth. The annual cost of these services is mainly based on a percentage of the funds under management each year (though the actual cost schedules are often complex). Because the plaintiff will need to spend part of his award on a financial manager, he therefore needs additional funds to cover these costs (that is, a management fee award). The difficulty arises when we consider whether or not the plaintiff will receive a higher rate of return on his investments, due to the expertise of the financial manager. That is, it may be the case that the financial manager’s fee will be at least partially offset by the increased return on investment. (For example, if I am paying a financial manager $5,000 per year, I expect that the return to my investments will be at least $5,000 per year greater than if I did not use a financial manager.)

However, this is not a simple issue. When we determine a reasonable real discount rate to use in our calculations, we assume that plaintiffs will invest their money in simple low-risk investments such as government bonds. It is our understanding that this is their only obligation – they need to do better than keeping their money in a safe deposit box, but they do not need to pursue an “active” (and more risky) investment strategy. However, when the plaintiff uses a financial advisor, what sort of service should we expect that the plaintiff will request? If the plaintiff requests that the manager act very conservatively and invest the money in a similar manner as is expected of a plaintiff-investor, then there will be no increased return to offset the cost of the financial manager. A management fee award will be needed. Alternatively, if the plaintiff is obligated to make full use of the financial advisor, then presumably the advisor will do better than the conservative government bond strategy assumed for a plaintiff-investor, and there will be a higher return to offset the costs. It may be the case that the total net return (after management fees) is higher than the return that can be earned by simply investing conservatively in government bonds. In order to properly estimate the awards in this case, we would need to estimate the expected long-run real rate of return that the manager will earn, re-estimate all our future loss calculations, and then estimate the management fee. Note that in any province with a mandated discount rate, the issue is even more complex, since the economist does not have the option to simply change the discount rate based on the anticipated investment strategy of the plaintiff.

Suppose it is the case that a plaintiff can use a financial manager and earn a net real return that is greater than the “normal” real rate of return earned by a plaintiff-investor. Why then would we not expect that all plaintiffs should use investment advisors, in order to best mitigate their losses? In a province with a mandated discount rate, if a higher net return can be earned using an investment advisor, then why does the mandated rate not reflect this?

These are complicated issues. In my view the preferred approach in most cases is to separate the plaintiff’s need for “financial assistance” from the actual management of her funds. “Financial assistance” would include the day-to-day services needed by a plaintiff who cannot manage her own financial affairs – such as bill-paying, handling spending money, paying taxes, and so forth. These services could presumably be handled by an accountant or a lawyer. The services would not include actual investment management – it would be anticipated that the person assisting with the plaintiff’s financial affairs would arrange for conservative investment of the plaintiff’s award in the usual low-risk vehicles. If it could be determined that this level of financial assistance would cost (say) $5,000 per year, than that cost could simply be incorporated as a normal cost of care, without introducing the difficult and contentious issue of financial management.

leaf

Derek Aldridge is a consultant with Economica and has a Master of Arts degree (in economics) from the University of Victoria.

Millott (Estate) v. Reinhard – Reconciling “dependency” claims under FAA with “estate claims” under SAA

by Derek Aldridge

This article was originally published in the Summer/Autumn 2002 issue of the Expert Witness.

In August of this year a decision was released in the case Millott (Estate) v. Reinhard (2002 ABQB 761). The decision was of interest to us, since Economica provided expert evidence for the plaintiff in this case – but there are some other aspects of the decision which will certainly be interesting to any lawyer who is involved in fatal accident cases in Alberta. In this article I will briefly discuss one of the most interesting findings.

The issue concerned how to reconcile “dependency” claims under the Fatal Accidents Act (FAA) with “estate claims” made under the Survival of Actions Act (SAA). Recall that the Brooks v. Stefura appeal decision (2000 ABCA 276) addressed the situation in which an heir to the estate (who is a potential recipient of the estate-claim award) is also one of the deceased’s dependants (and therefore is a potential recipient of an award for loss of dependency). Brooks offered the following guidelines at paragraph 14:

  1. calculate the dependency award for each dependant, including prejudgment interest if it is granted;
  2. calculate the lost years’ award, including prejudgment interest if it is granted;
  3. allocate the lost years’ award to each beneficiary in accordance with the deceased’s will, or if the deceased died intestate, in accordance with the ISA;
  4. compare the dependency award with the allocated lost years’ award for each claimant, and reduce the dependency award by the amount of the lost years’ award, which represents an accelerated inheritance;
  5. if the lost years’ award is greater, the claimant receives only that amount; and
  6. if the dependency award is greater, the claimant receives the full lost years’ award together with the difference between the two as the dependency award.

In other words, each surviving dependant is entitled to receive either his/her share of the estate claim or his/her loss of dependency claim, whichever is greater. This seems fairly straightforward, but there are some difficulties, which I addressed in an earlier article (“Estate Claims Following the Appeal Court Decisions in Duncan and Brooks“, Expert Witness Vol. 6, No. 1). The issue that was addressed in Millott is whether the loss of household services is to be considered separately from or together with the loss of dependency on income. This was answered in paragraphs 7 and 8 of Millott:

[7] … In the present case, there are, of course, dependency awards for both household services and transportation which had been provided by James Millott before his death. Despite the difference in the facts involved, Brooks is clear authority that the rationale for avoiding double recovery means that the dependency award amount used in the reconciliation process is only the loss arising from dependency on income, not from any other source (e.g., household services, which are not based on the deceased’s income level)….

[8] Only the dependency on income is generated by the deceased’s income stream. The dependency awards for household services and transportation are not linked to income, and should not be part of the reconciliation.

Thus, based on the Millott decision, it appears that if a dependant/heir’s share of the estate’s loss of income claim (under SAA) is greater than his loss of dependency on the deceased’s income (under FAA), then he is awarded the SAA amount, but can also receive any claim for loss of services under FAA. For example, we see at paragraph 15 of Millott, Mr. Millott’s two children received their shares of the SAA claim, in addition to an award for their loss of dependency on their father’s services (under FAA), as well as their statutory damages (under FAA).

Note that this situation will commonly occur when there is a surviving spouse and one or more teenaged children. I would expect that in most cases a teenaged child’s share of the SAA claim will exceed her loss of dependency on income (since the SAA claim continues for the remainder of her parent’s without-accident work-life, but the FAA claim continues only for as long as the child would have been dependant).

leaf

Derek Aldridge is a consultant with Economica and has a Master of Arts degree (in economics) from the University of Victoria.

Selecting the Discount Rate – An Update

by Christopher Bruce, Derek Aldridge, Scott Beesley, and Kelly Rathje

This article was originally published in the Winter 2001/02 issue of the Expert Witness.

In the Autumn 2000 issue of this newsletter, we conducted an extensive review of the various methods of measuring the real rate of interest, or discount rate, and presented evidence concerning the movement of those measures over the period 1995-2000.

At that time, we concluded that our best estimate of the long-run discount rate was 4.0 percent. But we added the caveat that, as interest rates in 2000 had deviated significantly from the average of the preceding years, it would be important to maintain a close watch on those rates – to determine whether 2000 was an aberration or whether it represented the beginning of a new trend.

In particular, we concluded that article with the statement:

If bond rates do not rise relative to the rate of inflation in the near future, we will be revising our real rate of interest forecast downward.

The purpose of this article will be to provide five additional quarters (15 months) of data to determine whether such a revision is appropriate.

Revised data

Tables 1 and 2 provide updates of the information contained in Tables 1 and 2 of the Autumn 2000 article. Four changes have been made to the latter tables. First, we have added data for the fourth quarter of 2000 and for all four quarters of 2001. Second, in some cases, the relevant statistical authorities have revised their estimates of the figures we reported previously. In those cases, we have provided the revised figures.

Third, we have added information concerning interest rates on five-year Government of Canada bonds. Finally, in the interest of space, we have omitted the estimates of the real rate of interest that relied on information concerning the “standard” inflation rate.

Table 1

Table 1 reports the “raw” data from which some of the real interest rate figures in Table 2 have been calculated. The first column reports the “core rate of inflation” – a measure of the rate of inflation that removes the effects of change in those components of the price index that often move erratically – such as food, energy, and taxes. It is often argued that this measure offers a more reliable predictor of future changes in prices than does the “standard” measure of price inflation.

The next three columns in Table 1 report the rates of return on Government of Canada 5-year and 10-year bonds and on 5-year Guaranteed Investment Certificates (GICs). The former represent the minimum rates of return that investors can expect on safe investments. The rate of return on GICs, on the other hand, represents the interest rate available on a mixed, low-risk portfolio of stocks and bonds.

Table 2 reports seven measures of the real rate of interest – that is, the rate of interest net of the expected rate of inflation. The first of these is the market-determined rate of return on “real rate of return bonds” – bonds whose value is denominated in terms of the real rate of interest. These bonds are of particular importance because they are purchased by sophisticated investors and because they tend to be held for long periods of time.

The second, fourth, and sixth columns report the 5- and 10-year government bond interest rates and 5-year GIC rates net of the core inflation measure.

Finally, columns three, five, and seven report the government bond and GIC rates net of the Bank of Canada’s target rate of inflation of 2 percent. As the Bank has managed to keep the core rate of inflation within a small band around this target for the last six years, it is widely believed that 2 percent is the rate that is expected by most investors. That is, investors are believed to act as if the real rate of interest is the observed, nominal rate less 2 percent.

Table 2

Interpretation of the data

The data in Table 2 indicate that real rates of interest are lowest on the shortest-term investments, GICs and 5-year bonds, and highest on the longest-term investments, 10-year bonds and real rate of interest bonds. This suggests to us that investors believe that the current slowdown in the economy, which has induced central banks to lower interest rates very significantly, may continue for two or three years but will not continue in the long term.

For this reason, we believe that it would be appropriate to adopt a two part forecast of real interest rates. Based primarily on the observed rate on 5-year Government of Canada bonds, we propose to use a rate of 2.50 percent for the first five years of all calculations. Based primarily on the observed rate on 10-year Government of Canada bonds, we propose to use a rate of 3.50 percent for all subsequent years. Note that the latter rate is close to the average real rate of return on GICs over the period 1964 to 1998, (3.58 percent), reported in Bruce, Assessment of Personal Injury Damages, Third Edition, at page 231.

Once again, however, in recognition of the uncertainty facing our economy, we will revisit this question at the end of this year.

leaf

Christopher Bruce is the President of Economica and a Professor of Economics at the University of Calgary. He is also the author of Assessment of Personal Injury Damages (Butterworths, 2004).

Derek Aldridge is a consultant with Economica and has a Master of Arts degree (in economics) from the University of Victoria.

Scott Beesley is a consultant with Economica and has a Master of Arts degree (in economics) from the University of British Columbia.

Kelly Rathje is a consultant with Economica and has a Master of Arts degree (in economics) from the University of Calgary.

The awarding of costs and payment of legal fees in a case brought before the Court: is there a potential injustice?

by Derek Aldridge & Ronald Cummings, QC

This article addresses an issue that was brought to our attention last year by Ronald Cummings, QC (Cummings Andrews & Mackay). It eventually led to an article that was published in the June 2001 issue of The Barrister. For the purposes of this article (published in the Winter 2001/02 issue of the Expert Witness), we focus on one particular issue contained in the earlier article.

Suppose that a defendant insurance company has incurred costs totalling $50,000 in the course of defending itself in a civil lawsuit. For simplicity, let us assume that the plaintiff’s costs were also $50,000. For simplicity, we will also ignore the size of the claim. If the plaintiff is successful in his action and is awarded costs, the defendant will not receive any relief from its $50,000 in expenses and it will also need to give $50,000 to the plaintiff to cover his costs. Thus, its total profit for the year will be $100,000 less than it would have been if it had been successful in the lawsuit and the plaintiff had been ordered to pay the insurance company’s costs. Clearly the defendant insurance company will need to generate $100,000 in revenue in order to pay for these costs.

Alternatively, let us suppose that the plaintiff was not successful in his lawsuit, and the Court requires that he pay the defendant’s $50,000 in costs. Thus, the plaintiff needs to have an additional $100,000 on hand to cover his own bill and that of the defendant. However, assuming that 25 percent of the plaintiff’s employment income goes toward income-tax, he will need to earn $133,333 in order to have $100,000 in after-tax dollars with which he can pay his bills. Because the plaintiff is an employee and not a business, he effectively faces a greater burden of costs if he loses the case than the defendant insurance company faces if it loses.

It is clear that there is an injustice due to the tax treatment of the employee-plaintiff versus the corporate-defendant. In this example, despite incurring the same costs ($50,000 each), a losing plaintiff will need to earn $133,333 to pay his bill, compared to a losing defendant which will only have to earn $100,000 to pay its bill.

Also, note that the tax treatment may affect a potential plaintiff’s ability and/or willingness to advance a “just-case”. Because these tax-effects clearly raise a plaintiff’s costs (both direct costs and potential costs if he loses his case), some just-cases “at the margin” will not be advanced because of unmanageable costs. Some of these cases would be advanced if the tax disincentives we have described were eliminated.

The fairest solution would be to allow the plaintiff to treat his payment of these costs as a deduction from his income (for tax purposes), so he would face the same burden as the defendant insurance company or a plaintiff-corporation. Of course this would require changing the tax laws – an option that is not available to the Court.

Note that the tax system has already been adjusted to allow income from structured settlements to escape tax. So if the plaintiff wins his case, favourable tax policies are already in place to ensure that his monetary compensation is not diminished by tax. A reasonable next-step would be to ensure that tax policies do not influence potential plaintiffs when they are deciding whether or not to advance a just-case.

leaf

Derek Aldridge is a consultant with Economica and has a Master of Arts degree (in economics) from the University of Victoria.

Ronald Cummings, QC is a partner in the firm Cummings Andrews & Mackay (www.camllp.com)

The Deduction for “Expenses Related to Earning Income” in Rewcastle

by Christopher Bruce & Derek Aldridge

This article was originally published in the Autumn 2001 issue of the Expert Witness.

The recent case of Rewcastle v. Sieben (9801 16002, Calgary, July 20) concerned an estate claim brought under the Survival of Actions Act (SAA). In his decision in that case, Justice Hutchinson introduced a new method for calculating the deduction for “expenses directly related to earning income.” In this article, we summarise Justice Hutchinson’s method and comment on its broader applicability.

The Decision

As is true in many fatality claims brought under the SAA, Bryana Rewcastle was a teenager when she was killed. Hence, when determining the value of her estate’s claim, Justice Hutchinson first recognised that her family status would have changed a number of times over her lifetime.

He found that from her teenaged years until her mid-twenties, she would have been single. Then she would probably have married and had children. Eventually, her children would have grown up and left home, leaving her, with her husband, a part of a two-person family.

Following a number of previous Court of Appeal decisions, Justice Hutchinson concluded that the percentage of Bryana’s income that would have been available to her would have been smaller, the larger was her family. For example, this issue was addressed in the October 2000 Alberta Court of Appeal decision in Duncan Estate v. Baddeley (2000 ABCA 277):

…Under the Harris approach, the deceased’s proportionate share of joint family expenses are included in personal living expenses. Duncan bore a one-fourth share of joint family expenses based on the trial judge’s finding that had Duncan lived, he would have had a wife and two children; had it been four children, only one-sixth of the shared family expenses would have been deducted. (Duncan [2000] at paragraph 22.)

In particular, Justice Hutchinson accepted evidence that 100 percent of her income would have been available to her when she was single, 50 percent when she was married but had no children, and 25.8 percent when she was married with two children. (The latter figure was not 25 percent as it was assumed that the children would not share in family expenditures on cigarettes and alcohol.)

He also accepted evidence that she would have been single for 6 years of her life (ages 22-27), would have been married with no children for 14 years (ages 28-30 and 51-62), and would have been married with two children for 20 years (ages 31-50). He found, therefore, that across those three stages of her life, an average of 45.4 percent of her income would have been available for expenditure on goods and services that would have benefited her.

But not all of that income would have been spent on “expenditures directly related to earning income.” Specifically, he accepted evidence that only 72.8 percent of family expenditures are spent on such items. [See Rewcastle, para. 171].

Hence, the living expenses deduction in her case was calculated to be 72.8 percent of 45.4 percent, or 33.05 percent. It is the latter figure that Justice Hutchinson deducted from the present value of Ms. Rewcastle’s lifetime after-tax income in order to obtain her estate claim.

We accept Justice Hutchinson’s general approach. However, we do question some of the specific numbers that he has employed.

Personal Expenditures

Justice Hutchinson concluded that a woman would have 100 percent of her own income available to her when she was single, 50 percent when she was married with no children, and 25.8 percent when she was married with two children.

Clearly, the 100 percent figure is correct.

We also accept that the 50 percent figure is correct. Following from Harris, the usual assumption is that the husband and wife each benefit personally from approximately 30 percent of family income and benefit equally from the remaining 40 percent. That is, total personal benefit is 30 percent plus half of 40 percent, or 50 percent.

The 25.8 percent figure is more problematic, however. The reason for this is that it is usually assumed that children consume a slightly lower percentage of family income than do adults. Thus, for example, assume (as is common) that the deceased parent’s personal expenditure would have amounted to 22 percent of family income and that expenditures common to the whole family would have amounted to 30 percent of family income (with the remaining 48 percent being divided among the other spouse and the two children).

In that case, the deceased would have benefited from 29.5 percent of the family’s income – 22 percent plus one-quarter of 30 percent.

This is a relatively minor point, however: if 29.5 percent is used instead of 25.8 percent in the Rewcastle case, the percentage of income available over Bryana’s lifetime would only have increased from 45.4 percent to 47.25 percent.

Expenditures Related to Earning Income

We have greater concern with Justice Hutchinson’s conclusion that 72.8 percent of income is devoted to items that are “related to earning income.” In particular, that figure was obtained by summing the percentages of income spent on: food, shelter, clothing, transportation, household furniture, household operation, health care, personal care, and education. (The omitted categories were: recreation, reading, tobacco and alcohol, miscellaneous, security, and gifts and contributions.)

But take just one of those categories, transportation, on which Ms. Rewcastle was assumed to spend 15.7 percent of her after-tax income. As that income was assumed to average approximately $35,000 (after tax), the assumption is that the entire $5,495 (= $35,000 x 0.157) she would spend annually on transportation would be “related to earning income.”

More specifically, as the Court of Appeal has ruled that expenditures on luxuries and on discretionary items are not to be included in the items assumed to be “related to earning income,” Justice Hutchinson’s decision requires that none of Ms. Rewcastle’s $5,495 annual transportation expenditures represented discretionary or luxury items. None, for example, would have provided her with discretionary “extras” on her automobiles or with luxury trips to sunny resorts.

Similarly, his decision requires that none of her $5,285 expenditures on food (15.1 percent of after-tax income), $7,735 on housing, and $1,785 on clothing were for discretionary or luxury items.

This assumption appears implausible to us. Surely some of her expenditures on clothing would have been for luxury goods, some of her expenditures on food would have been for restaurant meals, and part of her expenditures on housing might have paid for a main floor family room or a luxurious en suite bathroom.

If, reasonably, it is assumed that as little as 25 percent of her expenditures were for discretionary or luxury items, the percentage of her income devoted to items “related to earning income” would fall from 72.8 to 54.6, and the overall deduction for those expenditures would fall from 33.05 to 24.79 percent.

Conclusion

The Rewcastle decision has provided additional information concerning the method that is to be used to calculate losses in Survival of Actions cases. Nevertheless, some important questions, particularly those concerning the evaluation of discretionary and luxury items, remain unanswered. It is our understanding that the defendants in Rewcastle have sought leave to appeal. If they are successful, it is possible that the appellate court will resolve some of these questions.

leaf

Christopher Bruce is the President of Economica and a Professor of Economics at the University of Calgary. He is also the author of Assessment of Personal Injury Damages (Butterworths, 2004).

Derek Aldridge is a consultant with Economica and has a Master of Arts degree (in economics) from the University of Victoria.

Estate Claims Following the Appeal Court Decisions in Duncan and Brooks

by Derek Aldridge

This article was originally published in the Spring 2001 issue of the Expert Witness.

Introduction

In October 2000 the Alberta Court of Appeal released its decisions in Duncan Estate v. Baddeley (2000 ABCA 277) and Brooks v. Stefura (2000 ABCA 276). These decisions helped clarify a number of questions that had arisen concerning the calculation of loss of future earning capacity under the Survival of Actions Act. Although these clarifications will be of great assistance to counsel, a number of questions remain outstanding. I consider some of these here.

Calculation of the deduction for “living expenses” (the “lost-years deduction”)

The October 2000 decision in Duncan was the second Court of Appeal decision in that case. In that decision, the Court confirmed its 1997 ruling that five principles were to be applied when calculating loss of future earning capacity for a deceased individual who had no dependants. These are:

  1. The loss of earning capacity is to be calculated net of income tax.
  2. The Court should deduct from after-tax income an allowance for “living expenses,” which are defined as “the expenses that the victim would have incurred in the course of earning the living we predict he would earn.” (Duncan v. Baddeley [1997], 196 A.R. 161 at 172.)
  3. “The ingredients that go to make up ‘living expenses’ are the same whether the victim be young or old, single or married, with or without dependants.” (Harris v. Empress Motors, [1983] 3 All E.R. 561 at 575.)
  4. “A deduction of expenditures made for the benefit of dependants, however strong the bond and obligation to support them, is not permitted.” (Duncan [2000], at para. [21].)
  5. “[T]he deceased’s proportionate share of joint family expenses are included in personal living expenses.” (Duncan [2000], at para. [22].)

The Court then “concluded” that the appropriate living expenses deduction in the case of Dean Duncan was 35 percent (but noted the defendant had not submitted an alternative approach which followed the correct principles). I have two concerns with the latter result.

First, there are two components to the living expenses deduction – the portion of the deceased’s after-tax income that he would have spent on himself; and the deceased’s share of joint family expenses. We cannot find that these two factors add to 35 percent under normal assumptions.

When calculating losses in fatal accident claims, it is usually assumed that, in a family of two adults and two children (it was found that Dean Duncan would have had such a family), family income is divided approximately: 22 percent to each of the husband and wife, 26 percent to the children (together), and 30 percent to joint family expenditures. Under these assumptions, the living expenses deduction would have been, at most, 29.5 percent (22 percent plus one-quarter of 30 percent).

Second, there is reason to believe that the 22 percent figure used in fatal accident actions exceeds the figure that the Court of Appeal wishes to apply in estate claims. In fatal accident claims, the 22 percent figure represents the percentage of family income that is spent on (all) items that benefited the deceased alone. Thus, that percentage includes many “discretionary” or “luxury” items. It is clear from both Duncan and Brooks, however, that discretionary expenses and expenses on pleasure are not to be included in “living expenses”:

  1. In its 1997 decision in Duncan, the Appeal Court rejected the so-called “lost saving” approach to the calculation of living expenses because “[m]y life-savings would not tell one what I spent during my life on pleasure, as opposed to what I had to spend in connection with the earning of my income.” (Duncan [1997], emphasis added.) That is, the Court distinguished “pleasure” from living expenses.
  2. In its 2000 decision in Duncan, the Appeal Court again rejected the lost saving approach, in large part because it did “not differentiate between expenses incurred in order to earn a living, and discretionary spending.” (Duncan [2000] at para. [12], emphasis added.) That is, the Court ruled that expenses to earn a living do not include discretionary expenses.
  3. In Brooks, the Court of Appeal explicitly excluded the deceased’s expenditures on a motorcycle and electronic equipment from his living expenses because they were “discretionary items that were not necessary to maintain Brooks in order to earn his anticipated level of income” (Brooks [2000] at para. [29]).
  4. If the courts were to apply the reasoning used to construct the 35 percent figure in Duncan to a case of an individual who could have been expected to remain single, they would find that the living expenses deduction would approach 100 percent. That is, the “Duncan” method would approach the “lost saving” method. (A single individual spends all but his savings on his own consumption.) But the Court has explicitly rejected the lost saving method.

If the living expenses deduction is not to include discretionary or luxury expenses, that deduction could be expected to be somewhat less than 22 percent commonly used in fatal accident cases. If we select 15 percent as a “reasonable” estimate of non-discretionary expenses that (would have) benefited the deceased alone, then the living expense deduction becomes approximately 22.5 percent (15 percent personal expenses plus one-quarter of joint family expenses). Even this figure may be too high, because some of the joint family expenditures (30 percent of the deceased’s income) would have been discretionary expenses.

Varying the “living expenses” deduction over the deceased’s lifetime

The loss of income claim by the estate of Dean Duncan was 65 percent of the present value of his lifetime net employment income. Recall that Dean Duncan was 16 when he died, with no dependants – although the Court found that he would have eventually married and had two children. It remains unclear to what extent the 35 percent living expenses deduction might differ for people who were at a different stage of life. For example, would a 35 percent deduction also apply for a woman who was 45 years-old and single (without prospects of marriage or children) at the time of her death?

In the most recent decision in Duncan, the Court implied that the correct approach is to tie the living expenses deduction to the size of the deceased’s (without-accident) family at different stages of his life. Using this approach, the size of the living expenses deduction would be less in periods in which there is a large number of people in the household than in those in which there are few people in the household. (As the household size increases, less of the deceased’s income would have been spent on himself, leaving a larger portion to be claimed by the estate). For example:

…Duncan bore a one-fourth share of joint family expenses based on the trial judge’s finding that had Duncan lived, he would have had a wife and two children; had it been four children, only one-sixth of the shared family expenses would have been deducted. (Duncan [2000] at para. [22].)

This statement clearly suggests that the lost-years deduction will depend on the deceased’s family size. However, the message is mixed. One problem with tying the lost-years deduction to family size is that that approach does not appear to have been used in Duncan. As noted, in Duncan, the lost-years deduction was set at 35 percent and it was applied to Dean Duncan’s lifetime income. Employing the same reasoning that the Court used to obtain the 35 percent deduction, it is my understanding that a deduction of approximately 50 percent would have been appropriate for the period when Dean Duncan would have been married without children, 44 percent when he was married with one child in the home, and 35 percent when he was married with two children in the home. Since the Court did not use this approach in Duncan, it is not clear whether the Court has specified that a flat deduction should be used over the deceased’s entire (without-accident) life, or whether the deduction should vary over time. If the deduction should vary over time (with family size), then why did the Court not use that approach?

One might argue that, in Duncan, the Court chose a single unvarying deduction as a simple approach that would produce roughly the same result as using the slightly more complicated approach of varying the deduction over time. This argument fails, however, if it is found that the Court intended that the “conventional” deductions discussed above should be used as, in that case, the single deduction would have been much higher than 35 percent. Note that the “conventional” deductions are 50 percent for a one- or two-member family, 44 percent for a three-member family, and 35 percent for a four-member family. Given the findings of fact concerning Dean Duncan, if the Court had wanted to apply a flat lost-years deduction as a proxy for the time-varying deduction, it would have used a deduction close to 42 or 43 percent. If a 35 percent deduction applies to a four-person household, and the deductions are greater for households with fewer than four people, then the equivalent flat deduction must be greater than 35 percent. Since the Court used a flat 35 percent deduction, it is difficult to justify using a different approach, without contradicting the Duncan decision.

There is a circumstance in which a fixed 35 percent deduction might be justified, however. Earlier in this article, I argued that the appropriate deduction in a four person family was no more than approximately 22.5 percent, not 35 percent as is commonly argued. The equivalent figure for a three person family would be approximately 37.7 percent and for a two person family would be approximately 50 percent. It is possible that these figures could average 35 percent over the family’s life cycle.

If it is found that the living expenses deduction is to reflect non-discretionary expenses, then I believe that this would support a deduction that does not vary with family size. Although it is normally assumed that expenses on a spouse and children are “non-discretionary” (suggesting that the deduction would vary with family size), I believe that a case can be made for the supposition that they are discretionary.

Consider the example of a young couple that is deciding whether or not to have children. If they choose to have, say, two children, it is usually assumed that the children will create a new category of “non-discretionary” expenses. However, remember that the couple chose to have their children – in that sense, therefore, their expenses on those children are discretionary. That is, if one takes a short-run view, it appears that the parents have no choice but to spend a portion of their income on their children. But if one takes a lifetime view, it is apparent that the parents had a choice whether or not to spend that money, as they could have chosen not to have children. In this sense, expenditures on one’s spouse are also discretionary, in the sense that one could have chosen to remain single. According to this view, the portion of an individual’s income that would have been spent on truly non-discretionary expenses does not depend on whether he would have chosen to remain single, to marry, or to have children.

If the above rationale is ultimately rejected, and it is found that the size of the deduction does vary with family size, then in some cases great importance will be placed on the Court’s finding concerning a (deceased) young person’s without-accident lifestyle decisions. Suppose there is a case involving a deceased 17 year-old boy, who would have earned the income of an average university graduate. And suppose the Court is weighing two (drastically) alternative without-accident lifestyle scenarios for the boy: He would have remained single all his life, or he would have married and had five children. A finding for the latter scenario would lead to a loss probably more than double the result from the former scenario. And as noted above, I believe that (taking a long-term view) the deceased’s discretionary expenses would have been the same for either scenario (since he would have chosen to have zero or five children). Furthermore, although an “heir-centred” approach was explicitly rejected in Duncan in favour of a victim-centred approach, an approach which depends on without-accident family size is necessarily dependent on without-accident heirs.

Given the victim-centred approach, is it the case that a young victim who dies with (unfulfilled) plans to have a large family has lost more than if he planned to be forever single?

The choice between an award for loss of dependency and an estate-claim award

The Brooks v. Stefura appeal decision addresses the situation in which an heir to the estate (who is a potential recipient of the estate-claim award) is also one of the deceased’s dependants (and therefore is a potential recipient of an award for loss of dependency). Brooks offers the following guidelines at para. [14]:

  1. calculate the dependency award for each dependant, including prejudgment interest if it is granted;
  2. calculate the lost years’ award, including prejudgment interest if it is granted;
  3. allocate the lost years’ award to each beneficiary in accordance with the deceased’s will, or if the deceased died intestate, in accordance with the ISA;
  4. compare the dependency award with the allocated lost years’ award for each claimant, and reduce the dependency award by the amount of the lost years’ award, which represents an accelerated inheritance;
  5. if the lost years’ award is greater, the claimant receives only that amount; and
  6. if the dependency award is greater, the claimant receives the full lost years’ award together with the difference between the two as the dependency award.

In other words, each surviving dependant is entitled to receive either his/her share of the estate claim or his/her loss of dependency claim, whichever is greater. This seems fairly straightforward, but there are at least two important difficulties.

First, when comparing an heir/dependant’s losses under the Fatal Accidents Act (FAA) and the Survival of Actions Act (SAA), it is not clear from Brooks whether the loss of household services is to be considered separate from or together with the loss of dependency on income. Thus, suppose the heir’s share of the estate claim (from the SAA) is greater than her loss of dependency on the deceased’s income (from the FAA), but less than her loss of dependency on the deceased’s income and household services combined. Should she receive an award amounting to her loss of dependency on income and household services? Or can she instead receive her share of the lost-years claim and her loss of dependency on the deceased’s household services?

One possibility is that the heir/dependant has an “all or nothing” choice. Either she claims under SAA and takes her share of the estate claim, giving up any FAA claim (dependency on income or household services); or she takes her full claim under FAA and forgoes her share of the SAA claim. Another possibility is that the deceased’s without-accident income and household services are claimable separately, with the income claimable either under SAA or FAA. The spouse would then be entitled to her household services claim (under FAA), as well as either her dependency on his income (FFA) or her share of the estate claim (SAA).

The second difficulty is that strict application of Brooks could lead to total compensation that exceeds 100 percent of the deceased’s lifetime income. Consider the case of a deceased man who leaves behind a dependant wife and two children. Suppose both children are 17 at the date of their father’s death and they will only experience a loss of dependency for one year. And suppose the wife and two children are each entitled to one-third of the deceased’s estate (which would roughly be the case if the deceased died intestate). In almost all cases the children will have a larger estate claim (SAA) than a dependency claim (FAA). (This is because their dependency claim extends for only one year of their father’s without-accident work-life, but their share of the estate claim extends for their father’s entire work-life.) However, if the children receive awards representing their share of the estate claim, and the wife receives an award representing her loss of dependency on the husband’s income, it is quite possible that more than 100 percent of the deceased without-accident income will be allocated to the survivors.

There are at least three possible approaches that the Court could ultimately approve to resolve this difficulty. First, it is possible that the Court will allow this potential “overclaiming” of the deceased’s potential income. This seems unlikely, given the Court’s concern with “double-damages” in Brooks (see Brooks [2000] at para. [19]). Note however, that in a loss of dependency claim where there is no household services loss, the tax gross-up could also lead to more than 100 percent of the deceased’s income being allocated, and the Court has not taken steps to prevent this. Second, the Court might impose a constraint, such that the total awards allocated as estate claims and as losses of income dependency cannot exceed the total present value of the deceased’s after-tax income. A third possibility is that the Court could decide that the heirs/dependants as a group must choose between claiming under FAA or SAA. So in the example above (surviving wife and two 17 year-old children), it would be decided whether to claim under SAA or FAA and each heir would make his/her claim under that head. This could lead to some difficult situations since in many cases one heir might prefer a claim under SAA while another prefers to claim under FAA.

This is an issue that we will deal with in greater detail in the next issue of The Expert Witness.

Single individual

A question that the courts have not faced is how they should deal with individuals who would have been expected to remain single for the remainder of their lives. This might reasonably be the case, for example, if the deceased had been a confirmed bachelor in his or her 50s or 60s.

In that case, the approach favoured by the Court would have calculated the living expenses deduction by adding the deceased’s expenditures on personal expenses to the deceased’s “share of joint family expenditures.” But in a one person “family” the individual’s share of joint family expenditures is 100 percent. Hence, the method favoured by the Court would find that the deceased had spent 100 percent of his or her income on “living expenses” and the deduction would be 100 percent (or close to 100 percent). But this is just the “lost savings” approach that the Court has explicitly rejected. In short, the method favoured by the Court produces a result that the Court itself does not support.

This is not a result that the Court could reasonably have been expected to recognise without expert advice. However, as far as I know, it has not been addressed by any other economist. Nonetheless, it will need to be considered in order to establish a defensible approach.

Further issues

There are two additional issues that warrant further consideration. I mention them here briefly.

Could household services play a part in estate claims? Clearly the estate claim is one for lost earning capacity, but consider the case of a person who would not have earned any income, but would have performed valuable services. Could his estate make a claim under SAA? For example, suppose a young female lawyer is killed, but had she lived, she would have been a stay-at-home mother for five years. Is the estate’s loss over those five years zero? Negative? Of course in such a case the primary claim would be for loss of dependency, but in light of Brooks it is probably necessary to compare the size of the estate claim to the dependency claim.

Should the living expense deduction be a percentage deduction or a dollar deduction? Given that 35 percent was used in Duncan, would that same percentage have applied if the Court had found that he would have worked as a specialist physician (earning far more than the $35,000 per year that Dean Duncan would have earned)? A flat dollar deduction might be more appropriate, but it would also lead to more complicated calculations than a simple percentage deduction. And we would still be left with the problem of how (or whether) to vary the deduction with a person’s age, income, occupation, and so on.

leaf

Derek Aldridge is a consultant with Economica and has a Master of Arts degree (in economics) from the University of Victoria.

Selecting the Discount Rate

by Christopher Bruce, Derek Aldridge, Scott Beesley, & Kelly Rathje

This article was originally published in the Autumn 2000 issue of the Expert Witness.

One of the most important determinants of the lump sum award for future losses is the discount rate, or real rate of interest. Simply put, this is the rate of interest at which the plaintiff is assumed to invest the award, after the effects of price inflation have been removed.

For example, assume that the court has found that if the plaintiff was to incur a loss today, the value of that loss would be $10,000. But, because the loss will occur one year from now, and the rate of inflation between today and one year from now will be 2 percent, the loss will actually be $10,200.

The court must determine how much the plaintiff will have to invest today in order to ensure that he or she will have $10,200 available one year from now. The discount rate is the interest rate that is used to make this calculation. The purpose of this article is to determine the current value of the discount rate.

We proceed in four steps. First, we distinguish between “nominal” interest rates and “real” interest rates and explain why the latter are generally used in preference to the former. Second, we review a number of alternative methods of measuring the interest rate. Third, we review a number of methods of estimating the expected rate of inflation. Finally, we report the values of these alternative measures for the years 1997-2000 and we conclude with a recommendation concerning the appropriate value to be used today.

Real versus nominal interest rates

There are two methods of calculating the present value of a future loss. The first is to “discount” the loss by the “nominal” rate of interest – that is, by the rate of interest that is observed at financial institutions. The second is to remove the inflationary estimate from the projected loss, to obtain what is called a “real” loss, and then discount that loss by the “real” rate of interest – that is, the nominal rate after the rate of inflation has been removed. The two methods yield identical results.

For example, assume that the nominal rate of interest is 6 percent. The first method of determining the award is to divide $10,200 by 1.06, (that is, by 1 plus the interest rate). That number is found to be $9,623. It can easily be confirmed that if 6 percent of $9,623 is added to $9,623 one obtains $10,200. That is, if the plaintiff was to invest an award of $9,623 at 6 percent, he or she would have $10,200 at the end of one year.

In the second method, one first “removes” inflation, here 2 percent, from both the future loss and the nominal interest rate. In both cases, this is done by dividing by 1.02, (that is, by 1 plus the inflation rate). Thus, as intuition would suggest, the real level of damages is found to be $10,200/1.02 = $10,000. The real interest rate is found to be 1.06/1.02 = 1.0392, or 3.92 percent. (Note that, in the same way that 1.06 is 1 plus the nominal interest rate, 1.0392 is 1 plus the real interest rate.) When $10,000 is divided by 1 plus the real interest rate, 1.0392, one obtains $9,623, exactly the same answer that was obtained using the nominal method.

Economists generally prefer to use the real loss/real interest rate approach when calculating lump sum awards for future losses. The primary reason for this is that real interest rates tend to be much more stable and, therefore, much more easily predicted, than either inflation rates or nominal interest rates.

Alternative measures of the interest rate

Because plaintiffs often have to rely on the investment of their awards to provide a significant portion of their future incomes, it is important that they place their awards in relatively risk-free investments. For this reason, the discount rate is usually based on the rate of return on either long-term government bonds or secure private sector investments. Once a nominal rate has been determined for one of these investments, it is then necessary to determine an expected rate of inflation (over the duration of the investment) in order to calculate the real rate of return.

In this section, we will consider three types of secure investments. In the following section, we will discuss three methods of estimating the expected inflation rate.

Real return bonds The first investment vehicle is Government of Canada real return bonds. These are long-term, secure bonds whose rate of return is denominated in terms of a real interest rate. (That is, the government guarantees that the investor will receive a specified (real) interest rate plus the actual rate of inflation.) There are a number of advantages to using the rate of return on these bonds.

First, when that rate is used, it is not necessary to make a separate projection of the rate of inflation.

Second, these bonds are guaranteed by the government of Canada.

Third, the estimate of the real rate of interest that is obtained by observing the prices at which these bonds are traded in the financial markets provides an objective measure of the real rate of interest that is forecast by sophisticated investors. Note, we are not suggesting that plaintiffs should, or will, invest their awards in real return bonds. Rather, we are arguing that the observed returns on these bonds provides an excellent, objective measure of the expected real rate of return – as these bonds are purchased primarily by individuals who are close observers of money markets and who have a great deal of money at stake when selecting their investments. (Generally, it is pension fund administrators who purchase real return bonds.)

Recently, Ontario revised its Rules of Court concerning the selection of the discount rate. Whereas the previous rule required that the courts use a fixed rate of 2.5 percent, the new rule bases the rate on current observations of the interest rate on real return bonds. For further analysis of Ontario’s new rule, see the accompanying article “Ontario’s Mandated Discount Rate – Rule 53.09(1).”

Guaranteed investment certificates A second approach to the determination of the real discount rate is to identify a measure of the rate of return on a “safe portfolio” of investments (i.e. the kind of portfolio in which a plaintiff could be expected to invest) and to deduct from that rate the expected rate of inflation. We have long recommended that the rate of return on five year guaranteed investment certificates, GICs, be used for this purpose.

Again, as we commented with respect to real return bonds, we are not suggesting that the plaintiff should use his or her award to purchase GICs. Rather, as the types of investments contained in GICs are similar to those that one would expect a prudent investor to purchase, the rate of return on GICs provides an objective measure of the rate of return that plaintiffs can expect to obtain. (Furthermore, as the quoted rate on GICs is net of investment management fees, there is no need to make a separate calculation of the management fee.)

Long-term Government of Canada bonds The rate of return on long-term government bonds can be used as a benchmark against which to measure the returns on other investments. As these bonds are widely held by private citizens (unlike real return bonds) and as they are among the most secure investments available, it would be expected that plaintiffs would never earn a nominal rate of return less than that obtainable from Government of Canada bonds. (If the plaintiff’s investments began to obtain a lower rate of return, the plaintiff could always, easily, transfer his or her investments to government bonds.) Hence, any suggested discount rate must pass the test that it is not lower than the rate obtainable on government bonds. Conversely, we would suggest that the discount rate used should also not significantly exceed the government bond rate, as that would imply that plaintiffs should place their awards in unacceptably risky investments.

Estimating the rate of inflation

The real rate of interest is calculated by removing the effects of price inflation from the nominal rate of interest. As the interest rate is to apply to investments that will continue for many years into the future, the relevant rate of inflation is the average rate that is expected to apply over that future. We will discuss three methods of forecasting this rate.

Current rate of inflation One simple method is to assume that the current rate of inflation will continue into the future. Use of this rate is based on the observation that investors appear to adjust their expectations of the future when current conditions change. Often it is assumed that this shift of expectations occurs with a short “lag,” of six months to two years. But, in periods in which the rate of inflation is not changing quickly, only small errors will be produced if the current rate is used.

Core rate of inflation In Canada, the reported rate of inflation is measured as the change in the price level of a representative “basket” of goods over a 12 month period. For example, the rate of inflation reported for January 2001 will be the percentage change in prices between January 2000 and January 2001.

What this means is that if there is a large, one-time increase in prices in January 2000, measured inflation will be relatively high in each month from January 2000 to December 2000 and then will fall significantly in subsequent months. The reason for this is that the increased price level produced by the January 2000 price increase will continue to be in effect in every future month. Hence, in every month between January 2000 and December 2000, prices will be higher than in the corresponding month a year earlier. Inflation in those months will be correspondingly high.

For example, assume that the CPI had been 100 in every month during 1999, had risen to 110 in January 2000, and stayed at that level for the rest of the year. Then, in every month during 2000 the CPI would be 110, in comparison with 100 in the same month the year before. Hence, in every month in 2000 the rate of inflation would be reported as 10 percent – even though there had not been a price increase since January.

But, when calculating the January 2001 inflation rate, the price level for that month will be compared to a price level (January 2000) that already contains the one-time increase of January 2000. Hence, the measured rate of inflation in January 2001 (i.e. between January 2000 and January 2001) will drop back to the long-run maintainable rate.

In our example, if the CPI remains at 110 in January 2001, inflation between January 2000 and January 2001 will be 0 percent. The one time increase in January 2000 will have had only a temporary impact on the rate of inflation.

What this observation implies is that if we wish to use the current rate of inflation to forecast the long-run rate of inflation, we must first remove the effect of one-time price increases. The Bank of Canada attempts to provide such a measure of long-run price inflation with what it calls its core rate of inflation. In particular, this measure removes movements in the costs of food and energy and movements in prices due to the effects of indirect taxes.

For example, the core rate of inflation would not include the effects of the doubling of oil prices during 2000. Why? Because, although a doubling of prices from $15 a barrel to $30 (and higher) was not completely unexpected, very few observers expect to see prices rise much higher. Hence, even if prices remain at their current level, within 12 months of the initial increases, inflation (the change in the level of prices) will fall. (The increase in oil prices is an example of the one-time increase we discussed above.)

And, of course, if prices should fall back to their pre-2000 levels, short-term inflation will fall even more – perhaps into negative numbers – for the next 12 months. But no one will expect those low levels of inflation to continue any more than they expect the current high levels to continue.

The implication, then, is that the core rate of inflation may be a better indicator of the long-run, expected rate of inflation than is the measure that is usually reported in the press. For this reason, in the tables below, we report both the core rate and the published rate.

The Bank of Canada’s target rate For the last decade, the Bank of Canada’s monetary policy has been directed at producing a rate of inflation of 2 percent (plus or minus 1 percent). As anyone who can remember the 1970s and 1980s can attest, the Bank has been singularly successful in reaching this goal.

Indeed, it has been so successful, that we believe that it can be argued that most investors have come to believe that the long-run rate of inflation will be (approximately) 2 percent. (The Bank itself reports that most financial analysts are predicting inflation rates of approximately 2 percent. See Bank of Canada Monetary Policy Report, November 2000, p. 32.) For this reason, when determining the real interest rate, in the tables below, we report calculations employing an inflation rate of 2 percent.

The data

We present two tables. Table 1 reports quarterly values of the two nominal interest rates – 10-year Government of Canada bonds and GICs – and two of the measures of expected inflation – the standard version and core inflation – for 1997, 1998, 1999, and the first three quarters of 2000. (We do not report the Bank of Canada target rate of inflation, as it did not change over this period.)

Table 1

Table 2 reports the real rates of interest obtained, first, from the real return bonds and, second, from adjusting the two nominal interest rates by each of the three measures of expected inflation. This produces seven measures of the real rate of interest.

Table 2

What these figures suggest is, first, that the interest rate on real return bonds has been remarkably constant over the last three and a half years, rarely deviating very far from the 4.0 to 4.1 percent range until 2000, when it fell to approximately 3.7 percent.

Second, it is seen that the real rate of interest on 10-year government bonds has also fluctuated around 4.0 percent, but with far larger deviations than was seen with respect to the rate on real return bonds. Some of the wider of these deviations can easily be explained, however.

Note, for example, that the low real rates produced in 1998 and 1999 when the 2 percent inflation factor is used may have resulted because a long period of below-2 percent inflation had caused financial markets to believe that the Bank had lowered its target rate. (The conventional measure of inflation exceeded 2.0 percent only once between the first quarter of 1996 and the third quarter of 1999, when it was reported to be 2.1 percent in the first quarter of 1997.) If the markets had come to expect inflation rates of 1.5 percent in 1998 and 1999, for example, most of the real rates in those years would have been close to 4.0 percent.

The relatively high rates found in 2000 when long-run bond rates are discounted by core inflation, and the relatively low rates found in that year when they are discounted by the standard measure of inflation, could both be “explained” if it was found that financial markets had begun to accept the Bank of Canada’s statement that it was targeting a long-run inflation rate of 2 percent.

The consistently low rates found on GICs, however, are disconcerting. Over the entire period reported in Table 2, and for a number of years prior to that, the rates of return on GICs were significantly lower than those on government bonds. This suggests that plaintiffs would be extremely unwise to invest in GICs for the foreseeable future.

We conclude, therefore, that current estimates of the discount rate should be based on the rates observed on real return bonds and on long-term Government of Canada bonds. Arguably, these rates fluctuated around 4.0 percent for most of the last four years. They have, however, fallen slightly during 2000.

This raises the question of whether 2000 is an aberration, or whether the recent decline in real rates is the beginning of a long-term trend. Some evidence that the decline is expected to be short-lived comes from the Alberta government’s Budget 2000 documents. There, it is reported that nine respected forecasting agencies predicted an average interest rate on Government of Canada 10-year bonds of approximately 6.21 percent (over the years 2000-2003). As it is unlikely that those agencies would have forecast an inflation rate in excess of 2 percent, implicitly they have forecast a real rate of interest of approximately 4.1 percent.

In this light, we believe that a rate of 4.0 percent is the best, current estimate of long-run real interest rates. However, Economica will be monitoring movements in the interest rates on real return and 10-year Government bonds closely. If bond rates do not rise relative to the rate of inflation in the near future, we will be revising our real rate of interest forecast downward.

leaf

Christopher Bruce is the President of Economica and a Professor of Economics at the University of Calgary. He is also the author of Assessment of Personal Injury Damages (Butterworths, 2004).

Derek Aldridge is a consultant with Economica and has a Master of Arts degree (in economics) from the University of Victoria.

Scott Beesley is a consultant with Economica and has a Master of Arts degree (in economics) from the University of British Columbia.

Kelly Rathje is a consultant with Economica and has a Master of Arts degree (in economics) from the University of Calgary.

The Impact of Disability on Earnings: Results of the Health and Activity Limitation Survey

by Christopher Bruce, Derek Aldridge, & Kris Aksomitis

This article was originally published in the Spring 2000 issue of the Expert Witness.

The 1991 Census of Canada contained two questions that asked whether respondents considered themselves to be “disabled.” Using the answers to this question (and the answers to a second, preliminary survey), Statistics Canada was able to create a file of approximately 34,000 individuals that it considered to be disabled. These individuals were then asked to complete a lengthy, detailed questionnaire, known as the Health and Activity Limitation Survey, or HALS. Another (approximately) 100,000 non-disabled individuals were asked to complete a less detailed questionnaire.

As the HALS questions concerned factors such as health, income, and education, it held great promise for use in personal injury litigation. Indeed, it is possibly the most extensive and reliable study of the disabled that has ever been conducted (not just in Canada, but worldwide). And one does see allusions to HALS data in many experts’ reports. But, for various statistical reasons, the data that have been released by Statistics Canada have proven to be less valuable than might have been hoped. As a result, to those of us working in the field of damage assessment, HALS has been a great disappointment.

Economica recently obtained a copy of the answers provided by each of the respondents to the HALS survey. From these data we have extracted a number of statistics that we believe will be of interest to the personal injury litigation community. Although we cannot hope to resolve all of the problems previously associated with HALS data in this short article, it is our expectation that the data presented here will, nevertheless, be of value.

Earnings

We have obtained earnings data for both males and females, divided into four age groups, four education levels, and four levels of severity of disability; that is, for 128 categories in total. (128 = 2 x 4 x 4 x 4). For each of these 128 categories we calculate three figures:

  • The average earnings of individuals in the category who had at least some earned income, as a percentage of the average earnings of non-disabled individuals in that age/sex/education category who had some earned income.
  • The percentage of individuals in the category who had some earned income.
  • The average earnings of all individuals in the category, as a percentage of the earnings of all non-disabled individuals in that age/sex/education category. (This category differs from the first because it includes individuals who reported no earnings.)

We present these data in Tables 1a & 1b (pages 5 & 6). Figures are shown for each of the four education levels: less than high school, high school, college or trade certificate, and university. As one would have expected, in each category earnings rise as one moves from non-disabled through mildly, moderately, and severely disabled. (We define “mild,” “moderate,” and “severe” disability in an Appendix to this article, thus allowing readers to determine to which of those categories individual plaintiffs belong.)

In virtually all categories, it is seen that the predicted effect that disability will have on earnings is lower if it is known that the individual will be working than if it is not known whether he or she will be able to work. That is, the earnings of the disabled are a higher percentage of the earnings of the non-disabled among the working population than they are among the total population. This is because a higher percentage of the disabled than the non-disabled earn no income.

For example, among males aged 35-44 with a high school education, those with a “moderate” disability earned 68 percent as much as the non-disabled if they earned anything at all. But 38 percent of the moderately disabled individuals in this age/sex/education group reported that they had no earnings, whereas only 6 percent of the non-disabled reported that they had no earnings. Thus, inclusion of those with zero earnings in the earnings figures had a much greater impact on the average earnings of the disabled group than similar inclusion had on the average earnings of the non-disabled. The result is that the earnings of all moderately disabled individuals in this group were only 45 percent of those of all non-disabled individuals.

Charts 1a & 1b (pages 7 & 8) offer a graphical depiction of the data shown in the tables – and allow the reader to more easily observe the overall trend implied by the data.

Education

The earnings data reported in Tables 1a & 1b may underreport the effect of disability on earnings. The reason for this is that the disabled have lower education levels than do the non-disabled. If these lower levels result from the disability, then disability will have two effects: reducing earnings at each education level (Tables 1a & 1b) and reducing education levels.

In Table 2 (page 9), we report the distribution of education levels among the four categories of disability. It is seen in that Table that there is a higher percentage of university graduates among the non-disabled than among the disabled in every category; and a lower percentage of individuals who have not completed high school among the non-disabled than among the disabled in most categories. An interesting result is that mildly disabled males are much more likely than non-disabled males to have a college education or trade certificate. (However, this could occur if individuals with this level of education had a high probability of incurring injuries that caused mild disabilities.)

Conclusion

The tables and charts presented in this article suggest that the incomes of the disabled are lower than those of the non-disabled for at least three reasons: the disabled earn less when they work, even if they have the same levels of education as the non-disabled; the disabled are less likely to earn any income than the non-disabled; and the disabled have lower levels of education than do the non-disabled.

However, although the data presented here may be of some interest to personal injury litigants, the level of aggregation is so great that it seems unlikely that these data will be able to provide more than background information to the litigation process.

Appendix: Determination of the Degree of Disability

The purpose of this Appendix is to allow readers to determine whether Statistics Canada would classify a particular plaintiff’s disabilities as “mild,” “moderate,” or “severe.”

Statistics Canada asked 25 questions (see below), grouped into four categories. In the first category, the respondent was allocated a “score” of 0 if he or she answered “no,” a 1 if he/she answered “yes, but able,” and a 2 if he/she answered “yes, unable.” For example, the individual was allocated a 1 if he/she had difficulty hearing what was said in a conversation with one other person; and a 2 if he/she was unable to hear what was being said in such a conversation.

In the second category, the individuals were allocated a score of 1 if they answered “yes” to the question. (For example, “do you have difficulty with your ability to remember?”)

In the third category, individuals were shown a list of activities. If they were limited in their ability to engage in one of the activities they were allocated a score of 1; if they were limited in more than one of the activities they were allocated a score of 2.

Finally, individuals who had been diagnosed as legally blind received a score of 2.

The scores for all 25 questions were summed and individuals were allocated to the relevant levels of disability on the basis of their total scores. The scales used were:


LEVEL RANGE
Mild 1-4
Moderate 5-10
Severe 11-43


It will be apparent that these are very imprecise categorisations. For example, using Statistics Canada’s scale, both an individual who was legally blind and an individual with a weak back would be categorised as “moderately” disabled, even though a reasonable a priori expectation is that those disabilities would affect individuals’ earning capacities quite differently. Similarly, both paraplegics and quadriplegics would be categorised as “severely” disabled, even though, again, we know that those disabilities have quite different effects on earnings.

I. In this category, individuals receive 1 each time they indicate that they have difficulty with the activity, but are able to undertake it (“yes, but able”); and 2 each time they indicate that they have difficulty with the activity and are unable to undertake that activity (“yes, unable”).

1. Do you have difficulty hearing what is said in a conversation with

1.1 One other person?

1.2 A group of at least three other people?

2. Do you have any difficulty seeing the following when you wear your ordinary glasses or contact lenses?

2.1 Newsprint?

2.2 The face of someone across a room?

3. Do you have any difficulty speaking and being understood?

4. Do you have any difficulty:

4.1 Walking 350 metres without resting?

4.2 Walking up and down a flight of stairs?

4.3 Carrying an object of 4.5 kg for 10 metres?

4.4 Moving from one room to another?

4.5 Standing for more than 20 minutes?

5. When standing, do you have any difficulty bending down and picking up an object from the floor (e.g. a shoe)?

6. Do you have any difficulty

6.1 Dressing and undressing yourself?

6.2 Getting in and out of bed?

6.3 Cutting your own toenails?

6.4 Using you fingers to grasp or handle (such as using scissors)?

6.5 Reaching in any direction (e.g. above your head)?

6.6 Cutting your own food?

II. In this category, the individual receives 1 if he or she responds “yes” and 0 if he/she responds “no.”

7. Are you unable to hear what is being said over the telephone?

8. Do you have ongoing difficulty with your ability to remember or learn?

9. Has a teacher or health professional ever told you or a family member that you have a learning disability?

10. In the past, persons who had some difficulty learning were often told they had a mental handicap or that they were developmentally delayed or mentally retarded. Has anyone ever used those words to describe you?

III. In this category, the individual receives 1 if he or she responds “yes” with respect to one of the categories; and 2 if he/she responds “yes” with respect to two or more categories.

11. Because of a long-term physical condition or health problem (i.e. one that is expected to last longer than 6 months) are you limited in the kind or amount of activity you can do

  • At home?
  • At school?
  • At work?
  • In other activities (e.g. travel)?

12. Because of a long-term emotional, psychological, nervous, or psychiatric condition, are you limited in the kind or amount of activity you can do

  • At home?
  • At school?
  • At work?
  • In other activities (e.g. travel)?

13. Do you feel limited by the fact that a health professional has labelled you with a specific mental health condition, whether you agree with this label or not?

  • At home?
  • At school?
  • At work?
  • In other activities (e.g. travel)?

IV. Finally, if the individual had been diagnosed as legally blind, he/she was given a score of 2.

14. Have you been diagnosed by a specialist as being legally blind?

Table 1a: Earnings of disabled individuals compared to earnings of non-disabled individuals

Table 1a

Note: A dash indicates that the category’s sample size is too small to report a statistically reliable estimate.

Table 1b: Earnings of disabled individuals compared to earnings of non-disabled individuals

Table 1b

Note: A dash indicates that the category’s sample size is too small to report a statistically reliable estimate.

Chart 1a: Earnings of disabled males compared to earnings of non-disabled males

Chart 1a

Note: This chart graphically depicts the data shown in Tables 1a and 1b. The top of each bar represents the earnings of disabled males who reported earnings as a percentage of non-disabled males who reported earnings. The bottom of each bar represents the earnings of all disabled males (whether they reported earnings or not) as a percentage of all non-disabled males (whether they reported earnings or not). Where no bar is shown indicates that the category’s sample size is too small to allow us to report an estimate (corresponding to the dash in Tables 1a and 1b).

Chart 1b: Earnings of disabled females compared to earnings of non-disabled females

Chart 1b

Note: This chart graphically depicts the data shown in Tables 1a and 1b. The top of each bar represents the earnings of disabled females who reported earnings as a percentage of non-disabled females who reported earnings. The bottom of each bar represents the earnings of all disabled females (whether they reported earnings or not) as a percentage of all non-disabled females (whether they reported earnings or not). Where no bar is shown indicates that the category’s sample size is too small to allow us to report an estimate (corresponding to the dash in Tables 1a and 1b).

Table 2: The distribution of education levels among the four categories of disability

Table 2

leaf

Christopher Bruce is the President of Economica and a Professor of Economics at the University of Calgary. He is also the author of Assessment of Personal Injury Damages (Butterworths, 2004).

Derek Aldridge is a consultant with Economica and has a Master of Arts degree (in economics) from the University of Victoria.

Kris Aksomitis was a research associate with Economica and an MA student in Economics at the University of Calgary.

Fatal Accident Dependency Calculations

by Derek Aldridge

This article was originally published in the winter 1999 issue of the Expert Witness.

We occasionally review cases in which the defendant is arguing that, after a fatal accident, the surviving spouse is financially better off. This sort of argument can be somewhat appealing in certain circumstances, but upon closer examination the “logic” is always unsupportable. Of course, I am referring to the distinction between sole- and cross-dependency. In this article I will briefly explain what dependency rates represent, and then offer a fairly detailed explanation of the differences between the sole-dependency approach and the cross-dependency approach.

Dependency rates are used to estimate a person’s financial loss due to the death of his or her spouse or parent. In a two-person household, if the husband dies, then the wife will no longer benefit from her husband’s income. However, she does not need to be compensated for the loss of all of his income, since some would have benefited him only.

To properly compensate the surviving dependant, it is necessary to determine how much of the deceased’s income the survivor needs in order to maintain the same standard of living as if the accident had not occurred. To make this determination, one must estimate how much of the deceased’s income would be allocated to common expenditures (mortgage payments, for example), and how much would be allocated to each spouse’s personal expenditures (food, clothing, and hobbies, for example). Our research suggests that, in general, about 40 percent of after-tax family income is allocated to common expenditures, and 30 percent to each spouse’s personal expenditures. We make the reasonable assumption that each spouse allocates his/her income in this manner. Thus, the surviving spouse requires approximately 70 percent of the deceased’s “without-accident” income, in order to maintain the without-accident standard of living. That is, the survivor still needs the 40 percent of the deceased’s income that would have been spent on common expenditures, as well as 30 percent that would have been spent on the survivor’s personal expenditures, but does not need the 30 percent of the deceased’s income that benefited the deceased only. The 70 percent is the dependency rate. Thus, I would argue that if the deceased would have earned $30,000 per year (after taxes and contingencies), had the accident not occurred, then the survivor now needs 70 percent of this income, or $21,000 per year in order to maintain the without-accident standard of living.

This approach – known as the sole dependency approach – is very appealing in many cases, thanks to its simplicity and the intuitively reasonable results that it generates. However, it is often argued that it needs to be modified in order not to over-compensate the survivor. The issue is how to treat the survivor’s income that would have benefited the deceased only. One might argue that the survivor’s lost share of the deceased’s income should be offset against her financial “gain” because she no longer spends money on items which benefited her husband exclusively. This is known as the cross-dependency approach.

I will attempt to more clearly explain the distinction between sole- and cross-dependency through a series of tables in which we consider a range of possible incomes earned by a hypothetical couple. (For the purposes of this article, I ignore the effect of dependent children.)

Table 1 illustrates how a couple’s income is allocated among the three broad expenditure categories, for a range of different income levels. (The reason why several different income levels are presented will become apparent later.)

Table 1

We can take the examples shown in Table 1 a step further by examining the more general case in which we consider the income earned by both members of the household. This is shown in Table 2. Note that the “total family income” figures in Table 2 are exactly the same as those in Table 1. As are the spending allocation figures.

Table 2

We can take this example another step further by considering how each member of the household allocates his/her income. Presumably, both spouses follow the 40/30/30 percent pattern when spending their income. Thus, each allocates about 40 percent of his/her income to common expenditures, 30 percent to his/her own personal expenditures, and 30 percent to the spouse’s personal expenditures. In Table 3 I follow the examples from Table 2, except that I show the allocation of spending by each spouse. Note that the “total family income” figures in Table 3 are exactly the same as in Tables 1 and 2, as are the totals of the individual spending allocation figures.

Table 3

Using the figures shown in Table 3, I can estimate the survivor’s financial loss upon the death of his or her spouse. It is clear that for the survivor to maintain the same standard of living as if the accident had not occurred, he or she will need enough income to fund the common expenditures shown (columns c & d), as well as the expenditures that were for his/her own personal benefit (columns g & h). Thus, what the survivor has lost, due to the death of his or her spouse is the sum of columns c and g. (The survivor has not lost columns d and h because he or she is still earning the income to pay for those expenses.) This is the sole-dependency approach.

The cross-dependency approach asks the question, “What should happen with the share of the survivor’s income that the survivor would have spent on the deceased (column f)?” The cross-dependency approach finds that this income has been saved, and should be offset against the sum of columns c and g. It finds that the survivor’s loss equals c + g – f. (Instead of just c + g, which is the finding of the sole-dependency approach.)*

Note that the dependency losses using either sole- or cross-dependency are always reported as the total of c + g – f (for cross-dependency) or the total of c + g (for sole-dependency). This is conventional, but it would be equally reasonable to report the individual components under separate heads of damage. For example, considering the top row of Table 3, the results could be reported as follows:

Results Table

With the total cross-dependency loss separated into its individual components (above), it is clearer why I disagree with that approach. First, I do not believe that it is economically correct to deduct the portion of the survivor’s income that would have been allocated to the deceased’s personal expenditures ($10,500) from the other components of the loss. Second, I do not believe that this deduction is consistent with other forms of personal injury damage assessment.

From an economic standpoint, I do not agree that the survivor’s income that would have been allocated to the deceased’s personal expenditures ($10,500 in the above example) should be deducted from the other components of the loss. I think most would agree that individuals spend part of their income on their spouses because they want to – in economic terms, they receive an offsetting benefit. Following the death of a spouse, the best that a survivor can do is spend this money on alternative goods. But, since the survivor had previously chosen to spend this money on his or her spouse rather than these alternative goods, these goods must represent a “second-best” choice. For example if a surviving wife had previously been spending $3,000 on goods which benefited her (now deceased) husband alone, and she now spends that money on alternative goods then, at best, that expenditure leaves her no better off than before. She has simply transferred the $3,000 from one set of expenditures to another. Hence, the $3,000 should not be offset against her loss of dependency.

It is my view that the correct way to compensate the survivor in this case is for the defendant to provide her with the income contribution that her husband would have made, had the accident not occurred (that is, the contributions to common expenses and to expenses which benefited the survivor only). The portion of the wife’s own income that would have been spent on her husband should remain available to be spent elsewhere at its second-best use (on holidays, gifts, charitable contributions, or whatever). From an economic standpoint, this will not leave the survivor financially better off. To argue in favour of cross-dependency, one must surely explain why the survivor is expected to use a portion of her own employment income to offset the defendant’s obligation.

I also do not believe that the deduction component of the cross-dependency approach is consistent with other forms of personal injury damage assessment. Cross-dependency requires that a plaintiff’s losses due to an accident should be reduced by any “savings” due to the accident (see the discussion above). Similar “savings” are seen in other forms of personal injury damage assessment, but are not deducted from losses. For example, plaintiffs who will be forced to retire early (or are unemployable) due to their injuries will “gain” a great deal of leisure time during the years when they otherwise would have worked. The value of this gain in leisure is not deducted from their losses. A father who was injured in a car accident that killed his son will now “save” the money he would have spent on his son. That savings is not deducted from the father’s loss of income award. Quadriplegics will “save” money on shoes, golf memberships, ski passes, and so forth. That savings is not deducted from their other losses.

Another difficulty with the cross-dependency approach is that if one follows the methodology consistently, it leads to indefensible results in many cases. Following the examples shown in the tables above, we see – below – that if the deceased’s income was much less than the survivor’s then cross-dependency will show that the survivor’s loss is negative (a net gain).

Table 4

As shown by the examples in Table 4 (above), the sole dependency approach yields results that are, intuitively, much more reasonable, given a wide range of income assumptions. The sole-dependency approach will never find that a survivor is financially “better off” following the death of his or her spouse. As shown, the cross-dependency approach will yield such a result in cases in which the deceased earned much less than the survivor.

The “negative loss” results generated by the cross-dependency approach are often ignored, and it is stated that the survivor has suffered “no net financial loss”. Of course the true result implied by the cross-dependency approach is that the survivor has experienced a net financial gain. Cross-dependency is always ignored when the deceased did not earn any income (and the survivor was the sole income earner), since the method – if followed – will always show that the survivor is financially better off. If the cross-dependency approach was accepted, it would seem that in such a case the survivor’s gain in net income should be offset against his or her loss of dependency on household services. Of course it is not. In my view, part of the reason why the cross-dependency approach has enjoyed some level of acceptance is because its supporters only use it when it yields results that seem intuitively reasonable. When cross-dependency leads to the nonsensical results described here, it is usually (if not always) abandoned.

Footnotes

* Note that the above description of cross-dependency is sometimes stated differently, although mathematically it is the same. The other way to describe cross-dependency is that it is 70 percent of the couple’s combined pre-accident income, less the survivor’s income. That is, 0.7[a + b] – b, using the above table. This is the same as 0.7a + 0.7b – b. Note also that 0.7a = c + g; 0.7b = d + h; and b = d + f + h. Thus the cross-dependency loss equals c + g + d + h – [d + f + h]. This reduces to c + g – f, which is exactly the same as I noted above. [back to text of article]

leaf

Derek Aldridge is a consultant with Economica and has a Master of Arts degree (in economics) from the University of Victoria.

The MacCabe Judgment: Allowing the Use of Earnings Statistics for Males When Estimating the Future Income of a Female

by Derek Aldridge

This article was originally published in the autumn 1998 issue of the Expert Witness.

On October 5, the Alberta court released its decision in the case of MacCabe v. Westlock RCSSD #110 et al (action: 9303 05787). The judgment is important for many reasons, though the most important aspect from an economist’s point-of-view is that it recommended the use of male earnings statistics to estimate the future earnings potential of a female. In particular, it was found that Ms. MacCabe would have followed a career path similar to that of the average male. That is, the court concluded that she would not have taken significant amounts of time out of the workforce for child rearing, and she would not have worked part-time. Therefore, it found that earnings statistics for males should be used to predict what her income would have been.

Some of the most important sections from the decision (related to the male/female income statistics issue) are reproduced here:

[para468] Clearly the evidence establishes that the exceptional individual characteristics of the Plaintiff are such that her abilities would have commanded the equivalent salary of her male counterparts. She would have established a strong attachment to her career. The use of male wage tables is justified. In any event, I am of the view that any award which I grant to the Plaintiff should not and cannot be solely determined by her gender.

[para469] It is entirely inappropriate that any assessment I make continues to reflect historic wage inequities. I cannot agree more with Chief Justice McEachern . . . in Tucker, supra, that the
courts must ensure as much as possible that the appropriate weight be given to societal trends in the labour market in order that the future loss of income properly reflects future circumstances. Where we differ is that I will not sanction the “reality” of pay inequity. The societal trend is and must embrace pay equity given our fundamental right to equality which is entrenched in the constitution. . . .

[para470]  . . . The Court cannot
sanction future forecasting if it perpetuates the historic wage disparity between men and women. Accordingly, if there is a disparity between the male and female statistics in the employment category I have determined for the Plaintiff the male statistics shall be used, subject to the relevant contingencies. . . .

[para481]  I agree with Dr. Bruce that absent
the accident, the Plaintiff would have been committed to her career and there would not have been a significant withdrawal from the labour force. . . .

So what does this imply about future cases involving injured or deceased females? It seems clear to us that if it is accepted that a young female would have followed a career path similar to that of the average male (in which she works full-time and does not take significant amounts of time out of the workforce for child rearing), then it follows that income statistics for males should be used to estimate her pre-accident income. (We discussed this issue in the Autumn 1997 issue of the Expert Witness.)

But what if it is found that a young woman would have followed a traditional female career path? In this case we suggest that using income statistics for females will still probably underestimate the true income path, but using those statistics for males will probably overestimate the true income. The reality likely lies somewhere in between the two alternatives. However, the MacCabe judgment appears to leave open the possibility that earnings statistics for males could be used even for female plaintiffs who would have followed “traditional” female career paths. It may be the case that the courts will choose to apply earnings statistics for males, regardless of the evidence about the woman’s likely career path – as a sort of “social justice” choice (Recall paragraph 469 of MacCabe: “I will not sanction the ‘reality’ of pay inequity.”)

However, the same argument could possibly apply to other situations in which a certain group of people earn less, on average, than the average male. For example, it is well-known that, on average, Natives earn less than non-Natives. From the MacCabe decision it may follow that one should use average income statistics for males to estimate the potential income of a young Native male (or female), with no adjustment to account for the reality that the average Native earns less than average non-Native. Conversely, perhaps the defense could argue that a person who has been disfigured in an accident should not be compensated for the “appearance-discrimination” component of his loss of income because that would be an endorsement of the “reality” of discrimination. If the court chooses to correct for the reality of pay inequity, then this could raise some difficult issues for those of us involved in loss of income cases.

leaf

Derek Aldridge is a consultant with Economica and has a Master of Arts degree (in economics) from the University of Victoria.

Software Review: Personal Injury Damages Partner (Carswell)

by Derek Aldridge

This article was originally published in the summer 1998 issue of the Expert Witness.

The Personal Injury Damages Partner (PIDP) has the potential to be a very useful research tool for anyone specialising in personal injury damages. The software is a CD ROM product ($1,200 for a one-year subscription, with updates 6 times per year – see www.carswell.com) that runs under Windows 95, 3.1, and NT. Carswell describes the content as follows:

The information includes Goldsmith’s Damages for Personal Injury and Death which consists of digests of cases dating back to 1935. As well, the full text of selected cases dating back to 1986 have been included. Personal Injury Damages Partner also contains cross-references and topical indices in the Find infobase.

Certainly the information contained on the CD will be valuable to anyone involved in personal injury cases. However, learning to access this information (i.e., learning the user-interface) could be a daunting task for the less-advanced computer user. The CD does not come with any documentation, not even basic set-up instructions on the disc case – an unfortunate oversight. Advanced users shouldn’t have too much trouble getting started, but Carswell should do some work to bring this program up to the “ease of use” level that is expected these days.

Once I learned the basics of the program, I found it easy to browse through different personal injury topics. For example, one can easily browse through summaries of cases by injury type: hip injuries, paraplegia, brain injuries, speech impairment, and so forth. The case summaries are hyper-linked to the full text judgments which can be read on screen or printed. You can also easily browse through cases which were heard by a specific judge. And there is a general index that you can use to browse the cases. Browsing by topic worked well, but I found the search engine frustrating – I was able to construct queries but the results were not linked to the full-text judgments, summaries, or even the case name. The program simply showed me paragraphs from unknown judgments with my query words highlighted. Some good query examples should have been provided with the software.

The “front-end” interface (called Folio 3.1) which is used to access and search through the information on the disc looks and acts vaguely like a Web browser – there are coloured hyperlinks which you double-click with the mouse to jump to the destination. The Folio program is fairly easy to use, but I think it would be much easier to get up to speed if Carswell could set up their database so we could use our own Web browser to navigate the database. Unfortunately, the program’s help system is specific to the Folio user-interface and does not offer help that is specific to the Personal Injury Damages Partner.

One obvious question is what advantage does this program have over QuickLaw? Two important ones come to mind. First, the program focuses on personal injury cases, so one is not searching or browsing among countless decisions that do not concern personal injury actions. Also, since the product is contained on a CD, searching and browsing is much faster, and the program is more portable, than using the QuickLaw on-line service. Of course the CD media also has its disadvantages over QuickLaw – the information on QuickLaw is always up-to-date, while the information on PIDP is always out-of-date. Hopefully Carswell will eventually allow the user to access the very latest information over the Internet, otherwise, for the personal injury specialist, the PIDP can only be a companion to QuickLaw, not a replacement (assuming that having up-to-date information is essential).

This could be a very useful product if Carswell would improve the ease-of-use and offer a manual and some decent on-line help. As it is, PIDP will be great if you are willing to invest in a lot of training time (or if you are already familiar with the Folio 3.1 interface); but if you have very little patience for software that is not easy to use, then your time will be better spent improving your QuickLaw skills.

leaf

Derek Aldridge is a consultant with Economica and has a Master of Arts degree (in economics) from the University of Victoria.

Unresolved Issues in the Valuation of Estate Claims Under Survival of Actions

by Derek Aldridge

This article was originally published in the spring 1998 issue of the Expert Witness.

It has been nearly a year since the Duncan v. Baddeley court of appeal decision (Alberta Appeal #9503-0408-AC) allowed the estate of the deceased to claim for loss of income on behalf of the deceased. In that time we have been involved in estimating the estate’s losses in several of these cases. Discussions among our own staff (at Economica) and with our clients have raised numerous questions about the correct economic approach to valuing these losses.

As most of our readers know, the Duncan decision allowed the estate of a deceased individual to make a claim for the loss of the deceased’s income, under the Survival of Actions Act. This is in contrast to the usual claim under the Fatal Accidents Act in which it is only the surviving dependants who can make a claim for loss of dependency on income and household services.

Unfortunately, it remains quite unclear exactly how an estate’s loss is to be calculated. The guidelines offered in Duncan suggest that we should estimate what the deceased’s lifetime income likely would have been, deduct an amount for tax, and deduct a further amount representing what the deceased would have spent on necessities – or expenses incurred in the course of earning an income (The latter deduction is often referred to as the lost years deduction). However, although this general approach is outlined in Duncan, there remain many uncertainties.

First, consider the situation in which a deceased has left no dependants to make a claim for loss of dependency under Fatal Accidents. (Later I will address the situation in which there are dependents, leaving open the possibility of overlapping claims under Fatal Accidents and Survival of Actions.)

Fatal accident cases without dependants

The most important unresolved issue concerns the appropriate deduction from the deceased’s potential income. What should the size of this deduction be? Why is there a deduction at all?

It appears that the courts have endorsed the idea that a deduction should be made for cost of “necessities” that the deceased would have purchased, in the course of living and earning an income. This is similar to the “lost years” deduction that has been accepted in personal injury cases in which the plaintiff’s life expectancy has been reduced. (In these cases, the plaintiff is compensated for the income that he would have earned in the years that he is now not expected to be alive, less the portion of income that would have gone toward his basic necessities.) However, under Survival of Actions claims, we are not compensating the income-earner, so the logic behind this deduction is unclear. By allowing these estate claims, the court seems to have the goal of deterrence, rather than compensation, in mind. If so, then perhaps there should be no necessities deduction at all. Presumably if an “income-generating machine”, owned by the deceased, was destroyed in the same accident which killed the deceased, the estate would receive full compensation for the value of the income-generating machine – without any deduction.

If the goal is to compensate the estate for the deceased’s “lost pleasure” (analogous to compensation for “lost years” in a personal injury case), then we should deduct an amount corresponding to the basic necessities of living. Expenses beyond this surely would have provided pleasure to the deceased.

Without a goal of compensation in mind, it seems that any calculation of a lost-years deduction (and hence, the fraction of income payable to the estate) is arbitrary. In my view, it sounds equally reasonable to compensate the estate for half of the deceased’s income; or the amount by which his income would have been above-average; or the amount by which it would have been above the “poverty-line”; or any other amount.

Are we attempting to compensate the estate for what the deceased’s economic contribution to the world would have been, as if he had been an income-generating machine? If so, then we should be measuring something quite different than after-tax income less some deduction. And of course, the deceased’s economic contribution would have included non-market household services.

Household services is an issue that has not been addressed in these estate claims. So far it seems that only an amount corresponding to the deceased’s potential income is claimable, and the value of his or her services is not. However, it may be found that the deceased would not have ever been employed in the labour force, never would have earned a salary, but would have made significant labour contributions within his or her own home. The traditional homemaker role for women immediately comes to mind as an example. If it is believed that a deceased woman would have worked strictly as a homemaker, does her estate have a claim for a loss? From an economic standpoint it seems that it might. If the woman would have worked exclusively in the home, then she most likely would have had a spouse who was employed outside the home. There would be an implicit transfer of the spouse’s employment income to the homemaker (the homemaker is, to some extent, trading her household services for a share of her spouse’s employment income), and this income might be claimable.

Another way of looking at it is this: Suppose two young unmarried women died in an accident. The court finds that the first woman would have eventually worked as a full-time homemaker and mother in her own home, but would not have worked outside the home. The court also finds that the second woman would have worked for someone else, as a full-time nanny and homemaker, and would have earned $30,000 per year. Even though both of these women would have added similar economic “value” to society, the current economic approach which compensates for the lost labour market contribution would only allow a claim by the estate of the second woman.

Even if we ignore the issue of what deduction to make and assume that only employment income is to be considered, we still face uncertainty regarding tax. Under the Fatal Accidents Act, the award is based on the deceased’s after-tax income, to reflect that the dependants would have benefited from a share of after-tax income. Then the total award is “grossed-up” for tax that the dependant will pay, so that in every year of the future, he or she will have available the same income that he or she would have benefited from if the deceased had lived. The Duncan judgment suggests that we should also deduct tax, but there is no mention of a gross-up. Of course, the estate (whoever that might be) will face an increased tax burden due to the interest generated by the award and will therefore receive insufficient compensation without a gross-up. However, how do we gross-up an award to the estate? That would require that we know who (and how many) will benefit from the award, and we would need to make assumptions regarding their future income and tax situation. However, if the award is paid to the estate, then it seems that the court may not even know who will eventually receive the award, so a gross-up at the time of judgment would be impossible.

In an earlier Expert Witness article (“Implications of Duncan v. Baddeley“, The Expert Witness 2[2]) Christopher Bruce argued that a tax gross-up is not necessary for estate claims if there is no presumption that the estate is expected to invest the award in order to replace a future stream of lost income. However, without a gross-up, the estate will need to spend the entire award almost immediately in order to avoid tax-attracting interest, which would result in under-compensation. And if compensation is not the goal, then what is the purpose of deducting tax at all? Why not base the estate’s claim on gross income?

Fatal accident cases with dependants

In circumstances in which there are surviving dependants after a fatal accident, two additional questions arise. First, “What sort of claim would be more valuable, one under Fatal Accidents or one under Survival of Actions?” The second obvious question is, “Can there be two claims, one under Fatal Accidents and one under Survival of Actions?” The answer to the first question, under most (if not all) circumstances is that a loss of dependency claim under Fatal Accidents would be more valuable (see Christopher Bruce’sImplications of Duncan v. Baddeley“, The Expert Witness 2[2]). The answer to the second question may seem clear, but is not.

Most would probably not expect that the courts will allow surviving dependants to receive compensation for their loss of income and household services dependencies, and at the same time allow the estate to receive compensation for a portion of the income that the deceased would have earned. However, it may be possible for these two claims to co-exist if they do not overlap. That is, the survivors could be compensated for their loss of dependency, and the estate could be compensated for its loss, to the extent that the estate’s loss has not already been claimed by the dependants. For example, under a sole-dependency claim (where, say, there is only a dependant spouse), the spouse receives compensation for approximately 70 percent of the deceased’s after-tax income. The 30 percent that the spouse does not receive is the component of the deceased’s income that benefited the deceased exclusively. However, not all of that 30 percent would have been for necessities and therefore a portion may be claimable by the estate.

Also, if the court decides to apply a divorce (or remarriage) contingency to the dependant spouse’s loss, his or her award may be reduced dramatically. The part of the spouse’s award that is “lost” due to the divorce/remarriage contingency may be claimable by the estate. Taking this a little farther, it is possible that the estate could claim the component of the dependant’s award that is “lost” due to the application of a contingency for the survivor’s probability of survival.

If there is no surviving spouse but there is a surviving child, then under Fatal Accidents, we usually see that the surviving child’s claim only extends to his or her age of financial independence (usually age 18-22). Since the deceased may well have continued to earn income after this point, it seems plausible that for the period after the child’s “independence age”, the estate may be able to make a claim under Survival of Actions. For example, we could observe a case in which a surviving child claims an income and household services dependency loss over the period during which the deceased would have been age 35-45; and then the estate claimed a loss of income from the deceased’s age 46 to retirement.

Despite the difficulties involved in calculating the estate claim under Survival of Actions; from an economic (and, I would hope, logical) standpoint, it seems reasonable that we should be able to incorporate these estate claim “add-backs” after determining an appropriate award for loss of dependency.

Conclusion

The Duncan decision has left us with many questions about how to deal with estate claims. Before these can be answered, it seems that the Court will need to determine whether the goal of these claims is one of compensation or of deterrence. If compensation is the goal, then our task is to determine how to fairly compensate a deceased person’s heirs (the estate), when their financial loss due to the death is (in many cases) minor. If the goal is one of deterrence, then damages should reflect what the deceased’s contribution to society would have been – still a difficult task.

leaf

Derek Aldridge is a consultant with Economica and has a Master of Arts degree (in economics) from the University of Victoria.

Using Male Earnings Data to Forecast the Future Income of Females

by Derek Aldridge

This article first appeared in the autumn 1997 issue of the Expert Witness.

In two recent British Columbia judgments ([B.I.Z.] v. Sams, [1997] B.C.J. No. 793; and Terracciano v. Etheridge and Fujii, [1997] B.C.S.C. B943125), the court accepted use of average earnings statistics for males to estimate the future earnings of female plaintiffs. In this article, I investigate the reasoning behind the court’s decision, and the circumstances in which it might be appropriate for us to use male data when estimating female earnings.

As an introduction, I first consider some statistical evidence regarding the “wage gap” between men and women. How much of this gap is due to discrimination, and how much can be explained by other factors? Second, I examine how the wage gap has diminished somewhat over time. Finally, I consider the implication of the economic evidence, together with the recent court decisions.

The Wage Gap

As we know, women, on average, tend to earn less money than men. In fact, in 1991, average income for women was only 61.5 percent of that for men. However, part of this gap is because a higher proportion of women workers are part-time. If we compare women working full-time to men working full-time, we find that (in 1991), women earned about 70 percent as much as men.

However, a wage gap of about 30 percentage points remains. Can this gap be explained by educational differences – are women earning less than men simply because they do not invest in as much education? The answer is no. Even when researchers compare men and women with the same level of education, the wage gap remains. For example, statistics indicate that Canadian women with university degrees earn only 72 percent as much as Canadian men with degrees. Some, but not all, of this wage gap is due to discrimination in the labour market.

In fact, it appears that much of the wage gap is due to factors other than labour market discrimination. One source is that women tend to work fewer years in total, over their careers, than do men – they have a greater tendency to interrupt their careers and withdraw from the labour force (especially to raise children), and they are also more likely than men to work part-time. These factors are reflected in labour force statistics which indicate that while 95 percent of 25-44 year old male workers are employed full-time, only 77 percent of women workers of the same age are full-time. These factors effectively reduce the average amount of work experience that women accumulate over their careers (part of what economists call human capital). So because women, on average, bring less experience to their jobs, they also tend to earn lower incomes at any given age.

Based on this, we might expect that if we compared men and women in the same jobs, with the same education, and the same amount of work experience, the wage gap would disappear. However, that is not the case. A Canadian study examined this question by surveying men and women who graduated from Canadian universities in 1982 and comparing their annual incomes two years and five years after graduation. The study compared men and women who had completed the same type of degree in university and who had worked continuously over the study period. The conclusion was that, even when controlling for education and experience factors, women still earned less than men – after two years the study found that the women graduates were earning 88 percent as much as men, and after five years they were earning about 82 percent. This trend was visible even for women with master’s and doctoral degrees (though women with doctorates in medical and health sciences were earning more than their male counterparts after two and five years). A particularly notable result is that, on average, the gap between men’s and women’s earnings actually increased as their careers progressed.

This leaves an unexplained wage gap of at least 10 percent – it is this portion of the gap which is generally attributed to discrimination. However, not all of this “discrimination wage gap” is due to discrimination in the labour market. Some of it seems to be due to the type of career paths that women tend to choose within occupations – perhaps they are positioning themselves somewhat for a future point at which they expect to temporarily withdraw from the labour force or drop to part-time status. It also seems that, to some extent, women tend to be socialized – within their families, in school, and culturally – to choose different sorts of career paths than men. The portion of the wage gap that remains after accounting for these factors is due to labour market discrimination – maybe 3-5 percent.

Note however, that the tendency for women to be socialized toward lower-paying careers may result from systemic discrimination – discrimination between boys and girls in the way that they are raised. It is also sometimes argued that traditional women’s occupations are lower-paid because women predominate in these professions (to the extent that this is true, the labour market is responsible). If we include these forms of discrimination, then the total wage gap due to discrimination is more like 10-15 percent.

The Wage Gap: Changes Over Time

When deciding whether to rely on historical income statistics to forecast future earnings, it is important to consider whether the historical relationships of the past can be expected to apply in the future. Examination of historical average earnings statistics for men and women working full-time reveals that the average wage gap has shown a clear decreasing trend over time. Specifically, the ratio of average female earnings to average male earnings increased from 59.7 percent in 1971 to 73.1 percent in 1995. This trend is illustrated in Figure 1 below.

Figure 1: Ratio of Average Earnings of Females to Average Earnings of Males

Figure 1

If we adjust average earnings statistics for the effects of inflation (so that, for example, earnings in 1971, 1981, and 1991 are all expressed in 1996 dollars), we discover that average male earnings only benefited from slight real increases over the last 25 years. (Specifically, average male earnings grew at approximately 0.10 percent per year over 1971-95.) The average earnings of women, on the other hand, experienced noticeable real growth – approximately 1.28 percent annually over 1971-95. This suggests that the male-female wage gap is decreasing over time because women are experiencing significant real wage gains, while men are not. We suspect that this trend is largely due to women spending more time in the labour force (increasing participation rates), pursuing higher paying occupations (including many “traditional male occupations”), and facing less discrimination than in the past. The annual real wage gains of men and women over this period are shown in Figure 2 below.

Figure 2: Real Changes in Earnings of Males and Females

Figure 2

We noted above that women tend to participate less in the labour market than men – they interrupt their careers more often, and for longer periods of time. The tendency toward work interruptions among women is changing though – recent information from Statistics Canada indicates that women’s labour force interruptions are now significantly shorter than they were in the past: over half of all Canadian women now return to work within two years of an interruption, compared with only an eighth in the 1950s. As it continues, this trend will further narrow the wage gap. We also know that women with more education tend to return earlier to the labour force.

Given these trends, past earnings averages for women will not accurately reflect what the average woman will earn in the future. Women are catching up to men, and it seems reasonable that today’s young women can expect to earn approximately the same lifetime income as today’s young men, if they follow similar career paths.

Implications

What do these findings tell us about when we should use earnings statistics for men to forecast the future earnings of a woman? It seems that this would be appropriate if we have reason to believe that the woman involved would have followed a career path more typical of men than of women (historically). For example, if it is believed that a young woman would have worked full-time (or very nearly so), and without interruption, throughout her career, then it would appear to be appropriate to use earnings data for males in her occupation.

Of the two BC judgments noted at the beginning of this article, one involved a woman who had already established her career path at the time of the accident, while the other involved a young girl who had not completed high school. In the former, it was apparently reasonably clear that she was following the sort of career path that has been typical of males, rather than females. In the latter, it was argued that the girl would have followed a typical male career path. In either of these types of situations it seems that using average male earnings statistics will better predict what a woman’s future earnings will be (or would have been, but for an injury or death).

However, what if a plaintiff has not established a career path at the time of her injury, and it is unclear whether she would have followed a typical male or a typical female career path?

In these cases, economists have typically chosen to forecast a young woman’s income based on her expected level of education – using statistics representing average earnings for women with a certain level of education. Our discussion so far may seem to suggest that average earnings for males of the given education level might be a better choice than using that for females. However, there are some difficulties with this approach. As noted, on average, women tend to enter different careers than men, even when they are working full-time (that is, we still observe a trend of “typical male occupations” and “typical female occupations”). And the typical female occupations tend to pay less. Given this, we would expect that the average income for women of a given education will continue to be less than the average for men of the same education – even if the women are working full-time without interruption. This holds even if we believe that labour market discrimination will end.

This suggests that using male earnings data to forecast the earnings of a young woman might overstate the woman’s true earning potential if we are basing our income estimates solely on a given education level, rather than on a given education and a given occupation. (Though, using earnings data for females will almost certainly underestimate the earnings potential of a young woman.)

Alternatively, if one is calculating the young woman’s potential income by assuming that she would have worked at a specific occupation (as an economist, for example), then it would probably be more accurate to rely on male earnings data, and then explicitly apply contingencies reflecting the impact of possible labour force absences and part-time employment. By using historical data for males, we can hopefully correct for the errors introduced when we use historical data for women (which reflects women who followed different career paths and faced greater discrimination than women today and in the future). By directly applying the appropriate contingencies for non-participation and part-time employment, based on our knowledge of the particular plaintiff, we will adjust for the probability that the woman may or may not have followed a “traditional” woman’s career path. These two adjustments will allow us to determine a reasonable forecast of a woman’s earnings, knowing that even if she follows a “traditional” career path, she will likely not face the same degree of discrimination as faced by past women whose earnings formed the basis for current statistical averages.

We should emphasize, however, that these generalizations can always be overridden by the facts of a particular case. If it is reasonable to assume that a young girl would have followed a career path more typical of men than of women (even if we do not know what that career would have been), then it is also reasonable to use male earnings data to forecast her income.

leaf

Derek Aldridge is a consultant with Economica and has a Master of Arts degree (in economics) from the University of Victoria.

The Income Tax Gross-Up on a Cost of Care Award

by Derek Aldridge and John Tobin, C.A.

This article first appeared in the winter 1996 issue of the Expert Witness.

Consider a simple example where a plaintiff requires an award to pay for $11,000 in cost of care expenses one year from today. Assuming an annual (nominal, or observed) interest rate of 10 percent, this suggests that an award of $10,000 will be sufficient to cover the future cost of care expenses ($10,000 + 10% x $10,000 = $11,000). But suppose that the plaintiff’s interest income is taxed at a rate of 25 percent. Now $250 of the $1,000 in interest income is lost to tax, effectively reducing the interest rate from 10 percent to an after-tax rate of 7.5 percent (i.e., the plaintiff receives $750 after-tax interest on an investment of $10,000). One year from now the plaintiff will have only $10,750 to cover the $11,000 in expenses, a shortfall of $250.

To compensate for the tax impact, the plaintiff will require an additional award of $232.56 for a total of $10,232.56. Now the plaintiff will earn $1,023.26 in interest income (= $10,232.56 x 10%), of which 25 percent, or $255.82, will be lost to tax, for net after-tax interest income of $767.44. When the net interest income is added to the award, or capital, of $10,232.56, the plaintiff will have the required $11,000 to meet cost of care expenses one year in the future. The additional award of $232.56 is known as the cost of care tax gross-up.

Usually, the gross-up is reported as a percentage of the non-grossed-up award. In the example discussed above the tax gross-up would normally have been reported as 2.3256 percent of the “non-grossed-up” amount $10,000. Readers of The Expert Witness will know from experience that this percentage gross-up varies widely from case to case. The purpose of this article is to identify some of the factors which may affect the percentage gross-up.

Factors affecting the income tax rate (and the tax gross-up)

The gross-up is determined by calculating the plaintiff’s tax liability prior to considering the award for cost of care. This is compared to the liability including income generated from the award for cost of care. The gross-up is the additional capital required to fund the resulting tax liability.

The percentage gross-up is dependent on the plaintiff’s marginal tax rate and the plaintiff’s eligibility for various income tax credits. In the example above, if the individual’s investment income had been taxed at a marginal rate of 50 percent, instead of 25 percent, the effective after-tax interest rate would have fallen from 7.5 to 5 percent. A consequence of the increased marginal tax rate is that now the individual would have to invest $10,476.19 to provide $11,000 one year from today. That is, the percentage gross-up increased from 2.3256 to 4.7619.

A number of factors combine to affect the overall tax rate and the amount of tax paid on income invested to compensate for future costs of care. First, some of the future costs of care may be eligible for a medical tax credit (e.g., the cost of a wheelchair would typically be eligible for a tax credit). A tax credit reduces the plaintiff’s tax liability, at a certain percentage. The more expenses that the plaintiff has which are eligible for a medical tax credit, the lower his tax liability and the tax gross-up. To further complicate the tax calculation, it could be the case that once every five years the plaintiff will incur $50,000 in expenses, of which $40,000 are tax- creditable, while in the other years he faces costs of $20,000, of which only $5,000 are tax-creditable. Also, in certain circumstances the plaintiff’s injury may result in his qualifying for the disability tax credit. This will further reduce his tax burden (and the associated gross-up). In some cases, a severely disabled plaintiff may be entitled to a smaller gross-up, in percentage terms, than a moderately disabled person, as a result of his higher medical expenses and his eligibility for the disability tax credit (though the former’s total cost of care and gross-up will almost certainly be higher).

The plaintiff will usually have other sources of income which will affect the gross-up. Interest income on a loss of income award or a non-pecuniary award, as well as post-accident employment earnings or pension income will all attract tax, and will affect the marginal tax rate on the interest income earned from the cost of care award. (The percentage of tax applied to each dollar of additional income is the marginal tax rate.) The courts have ruled that the investment income from the cost of care award is to be added to all other sources of income and taxed at the rate associated with the highest tax bracket in which the individual’s income places him. To estimate the gross-up, details about the future cost of care requirements (and the associated tax credits) are required as well as information about all of the plaintiff’s expected income, including future employment income and any additional interest income that he will earn (especially from loss of income awards). The higher the plaintiff’s expected income, the greater the percentage gross-up resulting from income being taxed at a higher marginal tax rate.

A third issue to consider is the time path of award consumption. Just as the amount of any non-pecuniary and loss of income award will affect the tax gross-up, the time path of the consumption of these awards will affect the calculation. If the plaintiff spends his entire loss of income and non-pecuniary award immediately upon receipt, then the award will not generate any interest and will not attract any tax. Therefore, the plaintiff will be in a lower marginal tax bracket and he will pay a lower average tax rate over his lifetime on the award for cost of care. This would result in a lower tax gross-up. For the loss of income award, it may be argued that the plaintiff will consume enough of this award each year to compensate him for the income which he has lost due to his injury. For the non-pecuniary award, it may be assumed that the plaintiff will consume the award gradually over his lifetime, or alternatively that he consumes it quite quickly. Except for very large non-pecuniary awards, where the plaintiff does not have any other significant income, the variation of the consumption assumption on the award does not have a significant effect on the gross-up calculation.

We occasionally encounter cases where a plaintiff with a shortened life expectancy is expected to receive a “lost years” award (see “Shortened Life Expectancy: The ‘Lost Years’ Calculation” in the Spring 1996 Expert Witness) – this adds a further complication to the gross-up calculation. In such a “lost years” case, a plaintiff will receive a portion of the money that he would have earned in years in which he is now not expected to be alive. In these circumstances, if we assume that the plaintiff will consume enough of this award each year to compensate him for that year’s loss of income due to his injury, then he will not consume all of the loss of income award before his death. As an alternative in these situations, for the purposes of making the gross-up calculations, we assume that the plaintiff will consume the loss of income award at such a rate that by his expected death he will have consumed the entire award.

Given equal total awards, older plaintiffs will typically require lower gross-ups than their younger counterparts. This is because older plaintiffs will begin to draw on the capital amount earlier, so the interest income will decline more rapidly. A young plaintiff will usually consume only a portion of the interest income (which can be substantial) for several years before he begins to draw on the capital. Thus, we would expect that for several years a younger plaintiff will earn large amounts of (taxable) interest income, in excess of medical expenses which may be eligible for a tax credit. It should be noted, however, that if the plaintiff is a child then he may not be required to pay tax on any of the interest income earned on the cost of care award until the tax year of his 21st birthday. This would substantially reduce the tax gross-up. If a minor has a shortened life expectancy then it is conceivable that the gross-up would be nominal.

In the example described at the beginning of this article, it was assumed that the cost of care would be incurred one year hence. It can easily be shown that the tax gross-up will be larger, the further into the future is the cost of care to be incurred. For example, assume that $16,105.10 is to be replaced 5 years from now and that, again, the interest rate is 10 percent. In the absence of taxes on the investment income, this amount can be replaced with an investment today of $10,000. If the interest income is taxed at a marginal rate of 25 percent (resulting in an effective after-tax interest rate of 7.5 percent), the required award will increase to $11,218.15 – for a tax gross-up of 12.1815 percent (compared to 2.3256 percent in the earlier example). As the number of years over which the award is to be invested increases, the interest which will be earned on the award also increases. Hence, while the non-grossed-up award (here, $10,000) remains the same, the impact of income taxes increases, as does the percentage gross-up. In short, the longer is the period over which the costs of care are to be awarded, the higher is the percentage gross-up (everything else being equal).

Summary

To summarize, we have listed some of the factors which influence the value of the gross-up. Other things being equal, we can normally assume the following:

  • Cost of care award. A larger cost of care award will generate more interest and more tax. Thus it will lead to a higher gross-up.
  • Loss of income award. A larger loss of income award will translate to a larger cost of care tax gross-up.
  • Post accident employment income. Greater post accident employment earnings will lead to a larger gross-up.
  • Tax-creditable expenses. The greater the portion of tax-creditable expenses, the less tax will be paid. Thus the tax gross-up will be lower.
  • Time path of consumption. If a large portion of the cost of care award will be consumed early in the plaintiff’s life, then this will lead to a lower gross-up.
  • Age. Young plaintiffs will generally require larger gross-ups than will old plaintiffs, both because they will have more interest income and, therefore, be in higher tax brackets, and because their awards will continue much further into the future.

leaf

Derek Aldridge is a consultant with Economica and has a Master of Arts degree (in economics) from the University of Victoria.

John Tobin, CA, is a partner with Kenway Mack Slusarchuk Stewart LLP Chartered Accountants.

Adjusting Claims for Hours Devoted to Household Chores

by Derek Aldridge

This article first appeared in the summer 1996 issue of the Expert Witness.

When a claim is made for loss of household services capacity, we are faced with the challenging task of determining the claimant’s pre-accident household service contribution, and comparing this to his or her post-accident capacity for household services. The difference between the pre- accident contribution and the current contribution represents the claimant’s loss of household service capacity. One simple way of measuring this loss is to calculate the number of additional hours that it would take a replacement worker to perform all of the tasks which the claimant can no longer do. This is the approach taken by Economica.

However, the number of additional hours that a claimant would require to complete the chores which can no longer be performed may overstate the amount of time required by replacement workers; and therefore, using this estimate without adjustment would overstate the claimant’s true loss. Accordingly, an adjustment needs to be made to accurately estimate the claimant’s loss: replacement workers will typically be more productive than the claimant, so the “loss” of household service hours must be adjusted downwards to reflect this productivity. The question one asks now is, “How much more productive are replacement workers compared to the typical claimant?” The answer to this question will guide the adjustment we need to make to the number of lost household service hours claimed. Fortunately there is research in this area which we can rely on.

In his book Economics and Home Production – Theory and Measurement (Brookfield USA: Avebury, 1993), Euston Quah estimates the efficiency of replacement household service workers (i.e., “domestic help”). Based on a survey of 167 households Quah found that for 2-member households, hired help was 64 percent more efficient than the household members. For 3-5-member households, hired help was 46 percent more efficient; and for households with 6 or more members, hired help was 33 percent more efficient. For those families without children, Quah reported efficiency gains of 62 percent. For families with 1-2 children, he found efficiency gains of 43 percent, and for families with 3-5 children, efficiency gains amounted to 40 percent.

Quah concluded that the productivity of workers hired by small households was relatively high because those households tended to hire workers only to undertake specialised tasks, such as ironing. Larger households hired less specialised, housecleaning staff. Hence, as most calculations of the value of housework assume that it is non-specialists who are being hired, we recommend that the lower productivity factors identified above, 33-40 percent, be applied. This implies that the number of “lost hours” claimed should be reduced by 25-30 percent. (A worker who is 33 percent more productive requires 25 percent fewer hours to complete a given task.)

leaf

Derek Aldridge is a consultant with Economica and has a Master of Arts degree (in economics) from the University of Victoria.