One of the more difficult problems facing the courts in personal injury actions is determining the future earning capacity of aboriginal plaintiffs 1 . In this article, I report on data concerning aboriginal earnings that Statistics Canada has made available from the 2011 census – now known as the National Household Survey.
Note that the discussion below examines statistics for those individuals who fall within the “aboriginal identity” classification, as defined by Statistics Canada. That is, this is a general discussion and care should be taken, on a case-by-case basis, to ensure that the adjustments applied are relevant to the specific aboriginal identity and situation of the plaintiff.
1. Aboriginal incomes
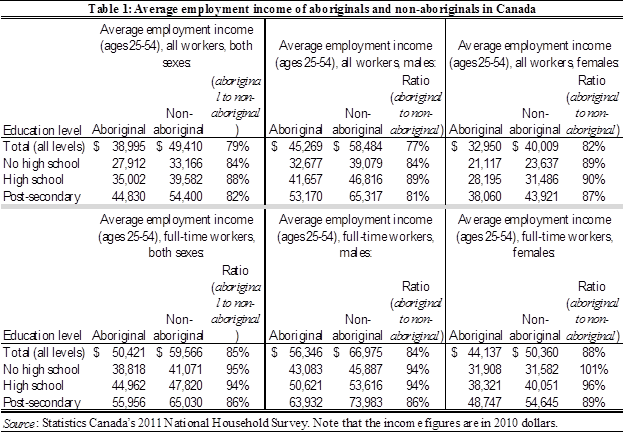
The “all workers” figures outlined in Table 1 (which consist of full-time and part-time workers, as well as individuals who were unemployed for part of the census year) indicate that aboriginals earned annual incomes that were equal, on average, to 79 percent of those of non-aboriginals. The difference is larger for males (at 77 percent) than for females (at 82 percent). When hours of work and unemployment are accounted for, the difference between aboriginal and non-aboriginal incomes becomes smaller, with aboriginal income equal (on average) to approximately 85 percent of non-aboriginal income. Again, the difference is slightly larger for males (at 84 percent) than for females (at 88 percent).
Four factors appear to explain most of the differences between aboriginal and non-aboriginal incomes:
- educational attainment,
- unemployment rates,
- labour force participation rates, and
- whether the individual lived on or off of a reserve.
I discuss each of these factors in the sections below.
2. Educational attainment
As shown in Table 1, the difference between aboriginal and non-aboriginal incomes varies by level of education. Education affects this differential in two ways.
First, as shown in Table 1, aboriginals earn less than non-aboriginals at each level of education. Second, as shown in Table 2, aboriginals (on average) have less education than do non-aboriginals.

The data in Table 2 indicate that, on average, aboriginal individuals are much more likely to be non-high school graduates than are non-aboriginals. This is significant given that the average income of a worker with a high school level of education is approximately 28 percent higher than the income of a worker without a high school education. Further, aboriginals are much less likely to complete an education at the bachelor’s degree level than non-aboriginals. Again, this is important given that the average income of a worker with a post-secondary education is approximately 81 percent higher than that for a worker without high school.
3. Rate of unemployment
In addition to differences in educational attainment, aboriginals were more likely to be unemployed than non-aboriginals.
In Table 3, I outline the unemployment rate of aboriginal and non-aboriginal Canadians at each level of education.
As shown in Table 3, the unemployment rate experienced by aboriginal Canadians is significantly higher (at about twice the rate) than for non-aboriginals.
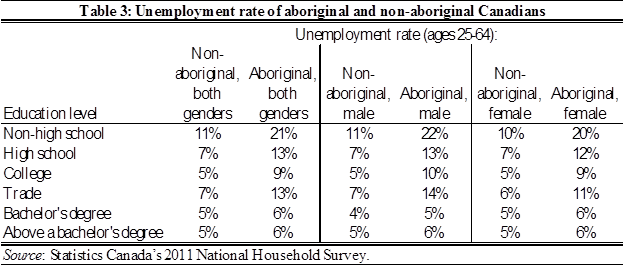
Educational attainment mitigates some of this effect, with aboriginal and non-aboriginal Canadians at the bachelor’s degree level or higher experiencing similar rates of unemployment. However, an unemployment rate for aboriginals that is approximately twice that of non-aboriginals appears to hold for levels of education below that of a bachelor’s degree.
4. Participation rate
In addition to difference in the unemployment rate and educational attainment of aboriginals, participation in the labour force is lower for aboriginals than for non-aboriginals. In Table 4, I outline the participation rate of aboriginal and non-aboriginal Canadians, at each level of education.
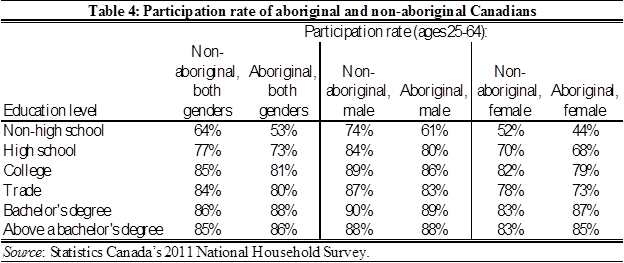
As shown in Table 4, approximately 74 percent of non-aboriginal males (with no high school education) participate in the labour force, while only 61 percent of aboriginal males at this level of education participate. This decreases to 52 and 44 percent for non-aboriginal and aboriginal females respectively.
5. Living on or off a reserve
The discrepancies in education, unemployment and participation rates discussed above become even more pronounced when comparing aboriginals living on reserve with aboriginals living off reserve.
Interestingly, the difference between the participation rates of aboriginal and non-aboriginal Canadians decreases as education level increases.
For example, for men with a bachelor’s degree or higher, the participation rates are about the same for aboriginals and non-aboriginals. For women with a bachelor’s degree or higher, aboriginal women actually have a higher participation rate than non-aboriginal women.
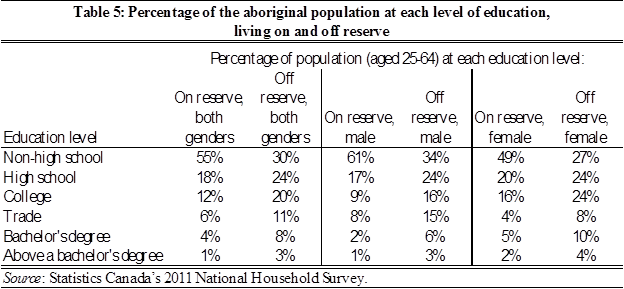
First, as shown in Table 5, the level of education is lower for aboriginals living on reserve than for those living off reserve. Again, a lower level of educational attainment will, on average, lead to a lower level of income, all else being equal.
Second, the unemployment rate experienced by aboriginals living on reserve is significantly higher than the rate of those living off reserve.
As shown in Table 6, males living on reserve experienced an unemployment rate that was approximately twice that of aboriginal males living off reserve, and this holds true regardless of education level.

Women living on reserve fared slightly better than males, experiencing an unemployment rate that was higher than, but not twice as high, as those living off reserve. Educational attainment mitigated this effect to some extent, at least for the level of bachelor’s degree or above.
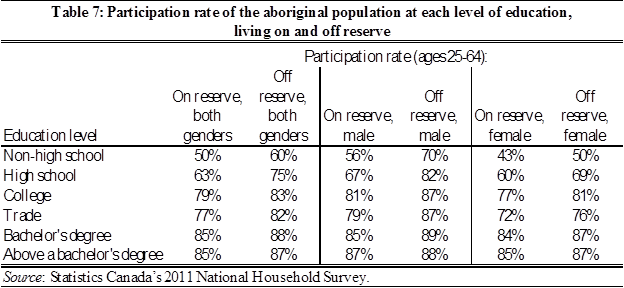
Third, participation rates decreased for aboriginals living on reserve, when compared to the rates for aboriginals living off reserve.
As can be seen in Table 7, participation in the labour force is higher for individuals living off reserve than for those living on reserve. However, educational attainment is a significant mitigating factor, with the difference in participation rates on and off reserve becoming smaller as the level of education increases.
6. Conclusions
In large part, these figures explain why the ratio of the earnings of aboriginals and non-aboriginals was much lower for “all workers”, 79 percent, than for “full-time” workers, 85 percent. And, when education level and work behavior are controlled for, aboriginal earnings are actually similar to non-aboriginal earnings. For example, at the high school level, the aboriginal income was equal to 94 percent of the non-aboriginal income for males, and 96 percent for females.
For example, male aboriginals with no high school diploma, living on reserve, had a participation rate that was 14 percent lower than those living off reserve, while the participation rate of males on reserve with a bachelor’s degree was only four percent lower than those living off reserve.
Notably, at the non-high school level, aboriginal females working full-time earned slightly more than non-aboriginal females (with aboriginal income equal to approximately 101 percent of the non-aboriginal income).
I believe that the conclusions outlined below can be drawn from the information discussed in this article.
- If nothing was known about a plaintiff except that he or she was aboriginal – for example, if the plaintiff was a child – it would be appropriate to assume that they would earn approximately 77 percent as much as a non-aboriginal for males, and approximately 82 percent as much as a non-aboriginal for females.
- If the education level of the plaintiff is known (or has been predicted), but the individual had not yet established a work history, then it would be appropriate to reduce the full-time figures for males by six percent for non-high school and high school, and by 14 percent for post-secondary. For females, there would be no adjustment necessary at the non-high school level, a four percent reduction at the high school level, and an 11 percent reduction at the post-secondary level.
- Further, in the above case, the unemployment rate would have to be adjusted upwards to equal twice that of an average worker for each education level except bachelor’s degree and above (as these levels of education do not require an adjustment).
- The adjustments described above would likely double for a plaintiff living on a reserve. That is, the unemployment rate of an aboriginal person living on reserve is approximately twice that of an aboriginal person living off reserve. Further, participation rates decrease significantly when a person lives on reserve, and educational attainment is much lower on reserve than off reserve.
- If the plaintiff had completed his/her education and had established a consistent work history, however, that history should form the primary determinant of the forecast of future earnings. The forecast would not require the application of adjustments related to the average aboriginal Canadian, as it would be based on the plaintiff’s demonstrated (i.e., actual) work history.
Footnotes:
- Aboriginal identity is defined by Statistics Canada as including “persons who reported being an Aboriginal person, that is, First Nations (North American Indian), Métis or Inuk (Inuit) and/or those who reported Registered or Treaty Indian status, who is registered under the Indian Act of Canada, and/or those who reported membership in a First Nation or Indian band. Aboriginal peoples of Canada are defined in the Constitution Act, 1982, section 35 (2) as including the Indian, Inuit and Métis peoples of Canada” (see Statistics Canada’s website, www.statcan.gc.ca).
![]()