This article was originally published in the Summer 2000 issue of the Expert Witness.
In many cases it is not clear at the time of trial what occupation the plaintiff would have entered had he or she not been injured, or what occupation he/she will now enter. In these cases, it is common for the vocational expert to offer a menu of possible occupations that are consistent with the plaintiff’s observed interests and aptitudes.
An issue that is crucial to the correct evaluation of damages in such cases, but which rarely receives the attention it deserves is: How should the incomes from the various occupations be “weighted” to determine an average, expected income for the plaintiff?
For example, assume that the vocational expert has concluded that, with appropriate upgrading, the plaintiff has the aptitude and skills to enter any one of three occupations – A, B, or C. Assume also that the following information is available about these occupations:
Annual incomes are:
A – $20,000
B – $25,000
C – $30,000
The number of employed workers in these occupations is:
A – 5,000
B – 1,000
C – 100
The unemployment rates in these occupations are:
A – 20%
B – 8%
C – 2%
The question is, how should the plaintiff’s expected income be calculated? I can think of four methods, each of which can easily be defended.
Simple Average
If the court has been provided with no information concerning which of these occupations the plaintiff will enter, it can be argued that, ex ante, there is an equal probability that he will enter each of them. Hence, each income should be weighted equally, producing an average of
($20,000 + $25,000 + $30,000)/3 = $25,000
Weight by Employment Opportunities
If it is assumed that the plaintiff will apply at random for jobs advertised in the newspaper, it is more likely that he will randomly “select” occupation A, with 5,000 jobs, than occupation B, with 1,000.
Alternatively, when the individual’s preferences are unknown, it can be argued that he is most likely to enter the occupations that other people have been observed to enter. Thus, as “most” individuals choose occupation A, it can be argued that it is more likely that the plaintiff will choose A than any other, all else being equal.
Recognising that there are 6,100 jobs in total, if income is weighted by employment opportunities, the average proves to be
[(5,000 x $20,000) + (1,000 x $25,000) + (100 x $30,000)]/6,100 = $20,984
Weight by Supply and Demand (Unemployment Rate)
If it is assumed that the plaintiff is more likely to be successful applying for jobs in which there are few applicants relative to the number of positions available, he is more likely to obtain a job at the occupations with the lowest unemployment rates. One method of allowing for this possibility is to weight the annual incomes by the inverse of their respective unemployment rates (that is by 1 minus the unemployment rate). These values are 80% for A, 92% for B, and 98% for C, with an average of 90%. Thus, relative to the average, the plaintiff is assumed to have a 0.889 (80/90) probability of finding a job at A, a 1.022 (92/90) probability of finding a job at B, and a 1.089 (98/90) probability of finding a job at C. In this case, the weighted average of the incomes in A, B, and C proves to be
(0.889 x $20,000 + 1.022 x $25,000 + 1.089 x $30,000)/3 = $25,333
Weight by Income
If it is assumed that the plaintiff is most likely to apply to the occupation with the highest income, the weightings change again. For example, if the probability that the individual will apply to each occupation is strictly proportional to the income earned in that occupation, the probability that he will apply to A is 80 percent of the probability that he will apply to B; and the probability that he will apply to C is 120 percent of the probability that he will apply to B. In this situation, the weighted average income will be
[(0.8 x $20,000) + (1.0 x $25,000) + (1.2 x $30,000)]/3 = $25,667
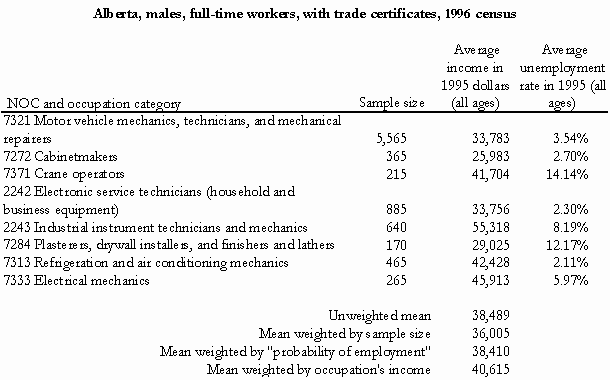
In the table below, I provide an example of these calculations drawn from a case in which Economica was involved recently. There it is seen that the vocational expert recommended eight possible occupations for the plaintiff. The average incomes for these occupations vary from $36,005 to $40,615, a difference of $4,610 per year, depending on which of the four averaging techniques is applied. If we assume that this individual was 25 years old at the time of the trial, an annual difference of $4,610 will alter the lifetime loss by approximately $100,000.
Clearly, it could prove crucial to determine which method is most appropriate. The first step is to speak to the vocational expert. Only if that expert indicated that the plaintiff was equally likely to enter each of the specified occupations would I consider it appropriate to employ the simple average method. If the expert has no opinion, my preference would be to weight the occupational incomes either by unemployment rate (to reflect supply and demand) or by numbers of employees (to reflect the likelihood that a plaintiff of known characteristics will choose a particular occupation). Weighting by income would only seem to be reasonable if the plaintiff was known to be particularly strongly motivated by financial considerations.

![]()