The Discount Rate Revisited (Summer 2006)

by Derek Aldridge

This article first appeared in the summer 2006 issue of the Expert Witness.

Our readers will recall that every year or two we review our standard discount rate assumption and publish our findings. It is time to repeat this exercise.

One year ago, in the Summer 2005 issue of the Expert Witness, we reported that real rates of interest (that is, the rate of return net of inflation) had continued their downward trend. We responded by lowering our forecast of the long-term real rate of interest to three percent – a rate that was slightly higher than the observed real rate of return on long-term Government of Canada bonds, long-term real rate of return bonds, and the long-term rate mandated in Ontario. (Higher rates lead to lower present values, so our estimates can be considered conservative.)

In addition, we made a change to how we applied our discount rate assumptions in our calculations. Previously we had assumed that the plaintiff’s entire lump sum award would earn a given interest rate, regardless of the fact that part of the award might be needed to fund next year’s losses and another part might be needed to fund losses 20 years from now. Our revised approach was to assume that the plaintiff will invest part of his award in short-term investments, part in medium-term investments, part in long-term investments, and so forth. This more accurately reflects the behaviour that would be expected from a plaintiff, and it more accurately reflects the different returns he can expect from his short-term investments versus his long-term investments. [*]

In our previous article we specified our assumptions for real interest rates for periods ranging from one-year to investments of 15 years or more. Our assumptions were based on the observed rates of interest on Government of Canada bonds of various terms. We now have four more quarters of rates to observe and we see that, except for the returns on long-term bonds, rates have increased. The trend in real rates over the last ten years is depicted in the chart below.
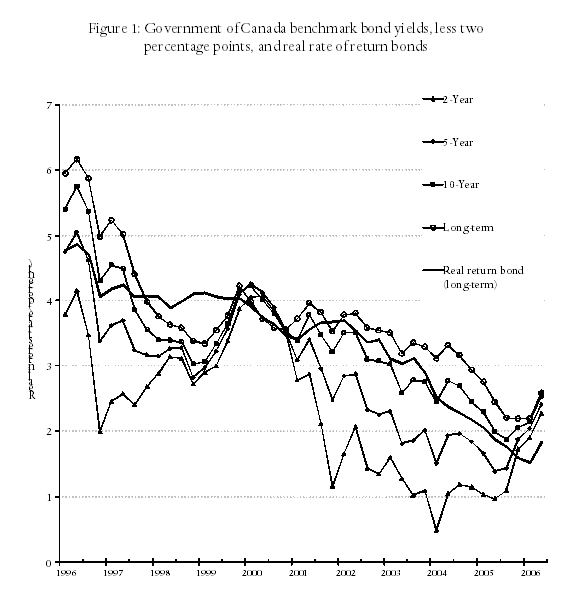
Figure 1

Note that to determine the real interest rate we deduct two percentage points from the “nominal” or observed interest rates to reflect inflation anticipated by investors. As the Bank of Canada has managed to keep the core rate of inflation within a small band around this target since the early 1990s, and as it has been the stated intention of not only the Bank of Canada but most other central banks (most notably that of the European Union) to keep the inflation rate at that level, there is now virtual unanimity among investors that two percent will be the long run rate of inflation in Canada. Accordingly, it can be concluded that investors have been acting as if the real rate of interest is the observed, nominal rate less two percent.

From the chart we see that most real rates began to rise with the third quarter of 2005. Long-term government bonds did not begin their rise until the second quarter of 2006 and are now only slightly higher than they were a year ago. The pattern has been similar for real rate of return bonds. Given these changes, we believe a slight increase in our shorter-term rates is warranted, though we will not change our longer-term rates. The most recent two years of real rates are shown in the table below, along with the rates that we will use in our calculations.
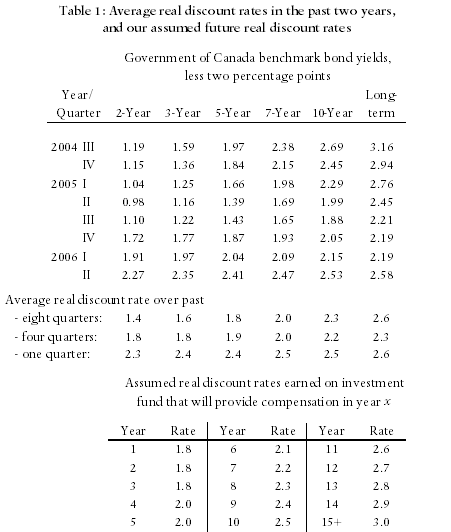
Table 1

The change from the rates we have been using for the past year is very modest. Only the rates for years 1-6 have changed at all, and these changes will have a negligible impact on our calculations. The present value of losses that will end within five years will decrease by about one percent relative to our previous assumption, while losses that extend for more than five years will fall by an even smaller amount.

Although we do not show the comparable interest rates on guaranteed investment certificates (GICs), we have examined them and they are consistently lower that the rates of return on bonds. For example, the real rates on 1-year GICs are currently about one percent, while the real rate on 5-year GICs is only about 1½ percent.

Note that we are not specifically assuming that plaintiffs will invest their awards in government bonds and hold them to maturity. There are a variety of reasonable investment strategies they could pursue. We use the observed rates on government bonds as an indicator of the rates that are anticipated by large institutional investors, with billions of dollars at stake. While one might find that a forecaster is suggesting that (say) 3½ percent is the appropriate real long-term rate, this prediction is contradicted by the fact that the Government of Canada is presently able to sell its long-term bonds which offer a real return of less than three percent. (If expert institutional investors anticipated that real rates on secure investments will average, say 3½ percent over the next ten years, then they would not buy bonds that pay only 2½ percent, and the Government of Canada would be forced to adjust its bond rates.)

Over the last ten years our assumption regarding the long-term interest rate has gradually declined from 4¼ percent to three percent. This decline has been in step with the observed rates, which can be seen in the above chart. Other economists have commented on our changes, with the implication that these changes demonstrate a weakness in our methodology. Our response is that the long-term rate has been changing over the past ten years, and it is important to reflect these changes in our calculations. To do otherwise would result in us using interest rates that are inconsistent with the rates that are actually available to plaintiffs.

Even if one finds that over the past few decades, long-term real interest rates have averaged 3½ percent, that rate is not now available to plaintiffs. Today’s plaintiff seeking secure investments simply cannot obtain a guaranteed long-term rate as high as the rates that were available 10 or 20 years ago. Even if the long-term rate rises to 3½ percent in five years, it does not follow that today’s plaintiff will be able to earn a long-term rate of 3½ percent, since he will be limited to the lower rates for the first five years.

As noted, we have changed our assumptions regarding the shorter-term discount rates, but not the longer-term rates. We expect that our estimates of the long-term rate discount rate will change less frequently and to a lesser extent than our estimates of the shorter term rates. This simply reflects that shorter-term rates are inherently more volatile than long-term rates. This can be seen in these charts (Figure 2), which show the percentage point changes in the quarterly real interest rates over the last ten years.

Figure 2

We will re-examine our assumptions next year, and expect that some minor adjustments in our shorter-term rates may be warranted, depending on the movement of rates between now and then. As noted, minor changes in our assumptions regarding short-term interest rates will typically lead to negligible changes to our present value estimates. The assumed longer-term rates have a greater influence on our calculations, and if the rate on long-term bonds remains significantly below three percent (as it has since 2004), it may be appropriate to adjust our long-term rates as well.

Footnotes

* To illustrate the effect of this approach, note that a child plaintiff who will not experience a loss of income for ten years will manage to earn a relatively high rate of return because he will be able to invest in “long-term” investments, and he will be more likely to benefit from possible future increases in interest rates. On the other hand, an older plaintiff who will experience a loss of income over the next five years only, will not be able to benefit from long-term investments or from possible increases in interest rates. She will face the low rates available on short-term investments. [back to text of article]

leaf

Derek Aldridge is a consultant with Economica and has a Master of Arts degree (in economics) from the University of Victoria.

The Cost of Household Services, Alberta, 2006: A Survey

by Christopher Bruce and Amelia Lamb

This article first appeared in the summer 2006 issue of the Expert Witness.

In 1997 and 1999, Economica conducted surveys of the cost of obtaining household services. At that time, we found that housecleaners in Calgary and Edmonton charged approximately $13.50 per hour; and that handymen charged approximately $24.00 per hour.

Since that time, we have estimated the current costs of household services by increasing the 1999 estimates by the intervening rate of wage inflation in Alberta. This implies, for example, that our estimate of the cost of housecleaners was approximately $16.00 per hour in 2005.

Increasingly, however, we have become aware that our estimates differ from the rates that prevail in Alberta, particularly in Calgary and Edmonton. The informal evidence available to us suggests, for example, that most housecleaners charge significantly more than $20 per hour.

For this reason, in late 2005 and early 2006 we conducted a new survey of household costs. In this survey, we obtained housecleaning, handyman, landscaping and snow removal, child care, and home care/meal preparation rates from a large sample of agencies and individuals in both Calgary and Edmonton, and housecleaning rates for smaller samples in Lethbridge, Grande Prairie, and Red Deer. We report the results of that survey in this article.

Housecleaning

Using newspapers and the Yellow Pages, we identified thirteen individuals or agencies in Calgary and ten in Edmonton that provide housecleaning services. We asked each of them to provide their hourly rate to clean a 1,600 square foot, two-story house (assuming there were not pets and that the cleaner would not be responsible for the basement). In Calgary, the average rate was $28.00 per hour ($26.22 if the top two rates are excluded), with a range from $21.25 to $38.00. As can be seen in Table 1, the most common rates (from seven agencies) were in the range of $24.00 to $27.50 per hour. Two of the thirteen rates were from individuals, who quoted $22.50 and $24.00 per hour, respectively.

In Edmonton, the average rate was slightly lower, at $26.10 per hour ($24.77 without the top rate); and the most common rates (from six agencies) ranged from $22.00 to $25.00 per hour. (See Table 1.)

Table 1

We were less successful at obtaining quotes in the other regions, obtaining only three in Lethbridge, two in Red Deer, and one in Grande Prairie. In those cities, the average hourly rates were: Lethbridge, $17.00; Red Deer, $21.00; and Grande Prairie, $22.50.

With the sole exception of the $17.00 figure for Lethbridge, it is seen that all of these figures significantly exceed the $16.00 rate that we estimated by increasing the 1999 rate by the average rate of wage inflation in Alberta.

We suspect that there are two reasons for the deviation of our predicted estimates from the actual figures, as indicated by the survey. First, it may be that the wages of individual housecleaners have been rising more quickly than the average. Second, anecdotal evidence suggests that the housecleaning sector has increasingly become dominated by professional agencies, whose hourly rates exceed the wages they pay to their employees, (in many cases by a significant margin).

This raises an important question: if employees are being paid, say, $14 to $17 per hour, and agencies are charging $25 to $35 per hour, why don’t individual cleaners leave their current positions and set up in competition with their former employers? Why doesn’t a worker who has been earning $15 per hour advertise his or her services at $20 to $30 per hour?

We suspect that the answer to this question derives from three factors. First, many cleaner-employees may lack the business skills to allow them to establish their own companies. These individuals may prefer to work for a company that offers them guaranteed hours and wages, as low as those wages may be, rather than take the risks of setting up their own firms.

Second, commercial firms often incur costs – for example, for cleaning supplies, advertising, insurance, transportation, administration, and employee bonding – in excess of the wages they pay to their employees. Individuals who established their own businesses would have to bear these costs themselves.

Finally, commercial firms may be better able than individual cleaners to develop reputations for reliable service. If a cleaner is sick or otherwise unable to work, a firm can often replace that individual with another employee; whereas if self-employed individuals are unable to meet their commitments, their jobs go undone. Customers may be willing to pay a premium for the more reliable service.

Regardless of the answer to this question, however, the fact is that it would be very difficult to hire a reliable housecleaner in Calgary or Edmonton for less than $20 per hour – and the expected cost is closer to $26 to $28 per hour.

Handyman

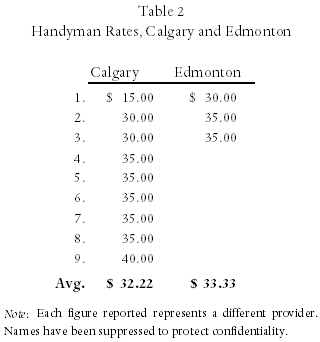
We obtained the names of handyman services in Calgary and Edmonton from newspapers and the internet. In each case, we asked agencies to quote for the hourly rate to either paint an interior room or repair a deck. The results are reported in Table 2. With the exception of one “outlier,” a $15.00 per hour rate quoted by a non-bonded, uninsured, non-professional student company, the rates in both cities fell consistently in the $30.00 to $40.00 per hour range, with an average of approximately $33.00 per hour in both cities.

Table 2

Landscaping and snow removal

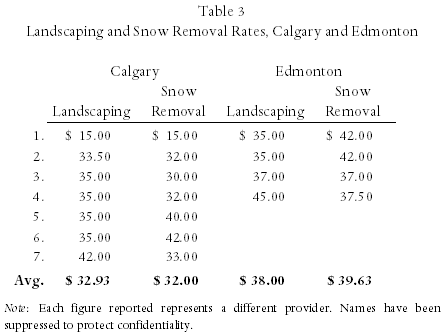
Landscaping and snow removal firms were identified online or from the Yellow Pages. In the case of landscaping, firms were asked for their hourly rates to mow lawns and conduct yard clean-up. The four firms we identified in Edmonton had slightly higher hourly rates, approximately $38.00 per hour, than did the seven firms surveyed in Calgary, where the average was approximately $33.00 per hour. (See Table 3.) It is possible that the difference between the two cities arose simply from the small sample size in Edmonton.

Table 3

Child care

There are two primary methods of providing (commercial) child care: nannies, who come in to the home, and day care. We obtained information about nanny services online and from the newspapers; information about daycare services was obtained from the Yellow Pages.

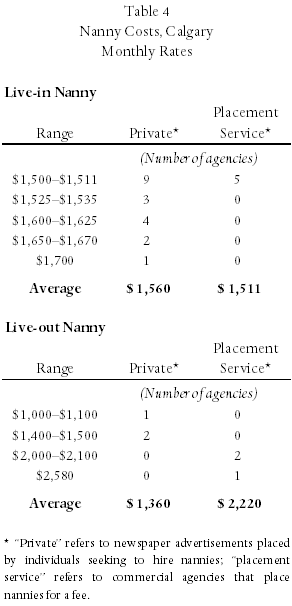
In Table 4, we provide information about “live-in” and “live-out” nannies in Calgary. Unlike Tables 1-3, we do not present information about individual rates, as we collected 30 observations. Rather, we report the number of observations in each of a number of ranges.

Table 4

The first column in Table 4 represents monthly rates that were offered in advertisements in the Calgary Herald by families who were seeking to hire nannies. The second column represents rates that private nanny agencies charge for placements.

We also obtained some information concerning the cost of nannies in Edmonton. (These data are not reported in tables as we had insufficient responses.) As in Calgary, the one nanny placement service we were able to identify charged $1,510.82 per month; and the hourly rate for (private) live-out nannies were from $8.00 to $16.00 per hour, with an average of approximately $11.75.

With respect to live-in nannies, the private and commercial rates were in agreement, at approximately $1,500 per month, or approximately $8.00 per hour. (Employers are required to pay at least the minimum wage for 44 hours per week, or $1,510.82 per month.) With respect to live-out nannies, however, private rates in Calgary, at $1,360 per month, were significantly less than commercial rates, at $2,220 per month, (or $11.50 per hour).

We suspect that the commercial rates in Calgary are more reliable estimates of the actual costs than are the private. First, the private rates in Edmonton are virtually identical to the commercial rates in Calgary. And, second, although we would anticipate that live-in nannies, who receive room and (some) board, would be paid less than live-out nannies, who have to pay their own room and board, the live-in rates offered in the Calgary newspapers were more than live-out rates.

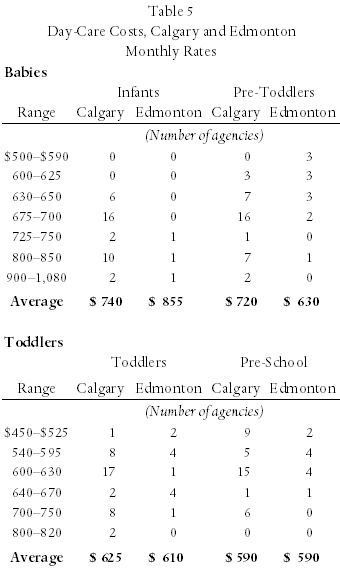
With respect to day care services, (Table 5), we found that, for the youngest children, there was a significant concentration of fees around $700 per month and another concentration around $800, with an overall average of $720 (pre-toddlers) to $740 (babies) per month in Calgary, (or approximately $4.00 per hour per child), and $630 to $855 per month in Edmonton. As we found only three day care centres that would look after babies in Edmonton, we prefer the Calgary figure. The pre-toddler figure appears to be lower in Edmonton than in Calgary because of the presence of a number of centres associated with the YMCA that provide low-cost care for this group.

Table 5

With respect to older pre-school children, we found that almost half of the agencies charged between $600 and $630 per month, with an overall average of $590 to $625 (approximately $3.00 per hour).

In Table 6, we report day care charges for pre- and after-school care for school-age children in Calgary. It is seen there that the most common rate is $300 per month, with an average across 23 agencies of $280. The two agencies we identified in Edmonton charged $335 and $320, respectively.

Table 6

Home care and meal preparation

Through the Yellow Pages and the internet, we were able to identify six agencies in Calgary that provide generalized home care services, such as meal preparation, light housekeeping, grocery and clothes shopping, grooming and dressing, bed-making, and bathing. Five of these six agencies charged between $21.00 and $23.00 per hour, with the sixth charging $17.95. If the latter is excluded, the average hourly rate was $22.00. We were unable to obtain rates for similar services in Edmonton.

Calgary’s Kerby Center also provided us with a list of six agencies that would prepare meals at home. Five of those six charged between $15.00 and $20.00 per hour, with an average of $17.50. The sixth agency charged $30.00 per hour, but was operated by a nutritionist who would design healthy menus, in addition to preparing meals.

Summary

In this article, we have reported the results of a survey of household services providers in Alberta. Two outcomes are very clear. First, it is inappropriate to use a single, hourly rate to evaluate all such services. Whereas child care services cost approximately $3.00 to $4.00 per hour per child (assuming that nannies care for two children on average), housecleaning services cost more than $25 per hour, and handyman and gardener services cost approximately $33 per hour.

Second, the convention of using $12 to $16 per hour for household services is insupportable. All of the services that were identified in our survey either cost significantly more than that or significantly less.

Proposal

In its publication As Time Goes by . . . Time Use of Canadians (Catalogue 89-544-XPE) Statistics Canada provides data concerning the amounts of time spent on six types of “household work and related activities.” These are: cooking/washing up, house cleaning and laundry, maintenance and repair, other household work, shopping for goods and services, and primary child care. For the purposes of calculating the costs of household services, we propose to combine “cooking/washing up” with “shopping” and evaluate that category at the approximate average rate for home care and meal preparation, $20.00 per hour.

We will combine “maintenance and repair” with “other household work” (a large portion of which consists of “gardening and ground work”) and evaluate the resulting services at the landscaping, snow removal, and handyman services rate of approximately $32.00 per hour.

We will evaluate “house cleaning and laundry” at the rate for housecleaning services. For the purposes of our reports, we propose to use the conservative rate of $25.00 per hour in Calgary and Edmonton, and $20.00 per hour elsewhere.

We will assume that it costs $700 per month to care for each baby, $600 to care for each toddler/pre-school child, and $275 per month to provide after-school care for each primary school-aged child.

Finally, we will continue to assume that replacement workers for the non-childcare services will perform these tasks more efficiently than the plaintiff would have. Specifically, we will assume a 25 percent reduction in the hours requiring replacement to reflect increased productivity on behalf of hired replacements. We do not make this adjustment for the childcare services, since if a child needs (say) three hours of after-school care, there is no opportunity to somehow provide this care in only 2½ hours.

leaf

Christopher Bruce is the President of Economica and a Professor of Economics at the University of Calgary. He is also the author of Assessment of Personal Injury Damages (Butterworths, 2004).

Amelia Lamb has been Economica’s office administrator since 2004.

Summer 2006 issue of the Expert Witness newsletter (volume 11, issue 2)

Contents:

  • The Cost of Household Services, Alberta, 2006: A Survey
    • by Christopher Bruce and Amelia Lamb
    • The article reports the results of a survey we conducted in late 2005 and early 2006. We obtained housecleaning, handyman, landscaping and snow removal, child care, and home care/meal preparation rates from a large sample of agencies and individuals in both Calgary and Edmonton, and housecleaning rates for smaller samples in Lethbridge, Grande Prairie, and Red Deer. In the article we present our findings and explain how we will apply these results in our calculations.
  • The Discount Rate Revisited (Summer 2006)
    • by Derek Aldridge
    • In this article Derek Aldridge reports on our latest survey of discount rates, and outlines the revisions we have made to our standard assumptions. We conclude that some small changes to our short-term discount rate assumption are warranted, though we have not changed our assumptions concerning long-term rates. The overall impact on our calculations will be negligible in most cases.

Spring 2006 issue of the Expert Witness newsletter (volume 11, issue 1)

Contents:

  • Estimating non-discriminatory lifetime earnings for young females
    • by Christopher Bruce and Kelly Rathje
    • This articles examines the sources of male/female earnings differentials that might arise from differences between the sexes in labour force participation rates, part-time hours, and retirement ages. It concludes that, even in the absence of labour market discrimination, women may earn 25 to 35 percent less than men.

Estimating non-discriminatory lifetime earnings for young females

by Christopher Bruce and Kelly Rathje

This article first appeared in the spring 2006 issue of the Expert Witness.

A number of judicial decisions have suggested that estimates of the lifetime earnings of young females should be based on data for males. Two arguments have been made in support of this view.

The first argument is that, as the differential between male and female earnings has been falling, incorporating the historical differential will understate the future earnings that young females will achieve once they become established in their careers. The second argument is that it is inappropriate for the courts to institutionalise current wage differentials that are based on discrimination.

The first of these arguments was alluded to in two BC judgments: ([B.I.Z.] v. Sams, [1997] B.C.J. No. 793; and Terracciano v. Etheridge and Fujii, [1997] B.C.S.C. B943125). The latter judgement involved a woman who was aged 16 when injuries from an automobile incident left her a paraplegic. In this judgement, Madam Justice Saunders indicated her preference for using earnings statistics of males to calculate Ms. Terracciano’s without-incident income:

[81] Indeed, it may be as inappropriately discriminatory to discount an award solely on statistics framed on gender as it would be to discount an award on considerations of race or ethnic origin. I am doubtful of the propriety, today, of this Court basing an award of damages on a class characteristic such as gender, instead of individual characteristics or considerations related to behaviour: Toneguzzo-Norvell (Guardian ad litem of) v. Burnaby Hospital, [1994] 1 S.C.R. 114.

The second argument was considered explicitly in the Alberta decision, MacCabe v. Westlock (RCSSD #110 et al [action: 9303 05787]). There, for example, the court accepted the use of income statistics for males to estimate the without-incident potential earnings of a young woman who had been paralysed while still a high school student. The court found that Ms. MacCabe had a without-accident income potential that was well above average. Importantly, the court argued:

[para468] Clearly the evidence establishes that the exceptional individual characteristics of the Plaintiff are such that her abilities would have commanded the equivalent salary of her male counterparts. She would have established a strong attachment to her career. The use of male wage tables is justified. In any event, I am of the view that any award which I grant to the Plaintiff should not and cannot be solely determined by her gender.

[para469] It is entirely inappropriate that any assessment I make continues to reflect historic wage inequities. I cannot agree more with Chief Justice McEachern . . . in Tucker, supra, that the courts must ensure as much as possible that the appropriate weight be given to societal trends in the labour market in order that the future loss of income properly reflects future circumstances. Where I differ is that I will not sanction the “reality” of pay inequity. The societal trend is and must embrace pay equity given our fundamental right to equality which is entrenched in the constitution. . . .

However, these decisions were silent about the possibility that women might earn less than men even after discriminatory practices had been removed. Importantly, for example, the Court of Appeal in MacCabe (9803-0617AC) rejected the trial court’s finding that male contingencies (such as for non-participation, unemployment, and so forth) should be used when estimating Ms. MacCabe’s losses.

[105] In general, tort law and in particular, the quantification of damages necessitates an individual approach. This is where I find the learned trial judge erred. In attempting to rectify potential inequities in the methods for quantifying damages, the learned trial judge neglected to focus on the evidence and the individual actually before her. While principles of equality should inform tort law, the learned trial judge’s application of equitable principles resulted in her ignoring some of the relevant material facts.

[106] In this case, based on the evidence, it was not reasonable to calculate MacCabe’s damages based on male contingencies. MacCabe stated she wanted to have children and would have preferred to stay at home with them for some period. This meant she would not have worked a pattern typical for male physiotherapists. There was no evidence to indicate it was more likely that MacCabe would not have had children and chosen not to take time off from full time paid employment as a physiotherapist. Thus, it would be inappropriate to apply male contingencies to her when there was no evidentiary basis that she would have worked a typical male pattern.

The appellate court in MacCabe recognised that, even in a world in which men and women experienced equality of opportunity, incomes might differ between the sexes if they made different choices. Most importantly, women might choose to take more time off to care for children; might choose to work fewer hours per week or weeks per year; and might retire earlier than men.

If this is true, one approach to predicting the earnings of young women might be to take current earnings data for men and adjust them downward for these differences in contingencies. In this article, we consider the impacts that each of four such contingencies might have on the male/female earnings differential.

Participation rates

The percentage of any group that is either working or available for work at any time is known as the “participation rate.” Primarily because of the impact of child-rearing, women have lower participation rates than do men at virtually every age. Hence, if everything else is equal, women’s earnings in an average year will be lower than men’s in proportion to the differences in participation rates.

Statistics indicate that the best predictor of whether a particular woman will be in the labour force in the future is whether she was in the labour force in the past. In particular, married women who had been working prior to the birth of their first child have a strong tendency to return to work within one to two years of the birth of that child. Nonetheless, there is a large number of women who delay re-entry until their youngest child is of school age. [1]

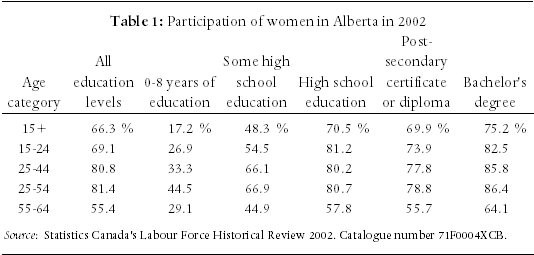
Also, many authors have detected a strong positive correlation between education level and female participation. That is, the most highly educated women tend to have the strongest attachment to the labour force. Table 1, for example, indicates that 86.4 percent of 25-54 year-old, university-educated women in Alberta participated in the labour force in 2002, compared with 80.7 percent of 25-54 year-olds who had high school education. (Participation rates drop significantly after age 54 due to retirement.)

Table 1

Note that the figures reported in Table 1 reflect the current labour force participation of women. It seems likely, however, that women who are currently in their 20s and 30s will maintain their high participation rates as they age. Therefore, the figures for the older age categories, in Table 1, might be adjusted upwards when projecting the future behaviour of plaintiffs who have not yet reached the age of majority.

Given the figures in Table 1, and recognising that male participation rates are approximately 95 percent for all age and education groups (between 24 and 54), the earnings for females might be estimated by reducing male earnings by the difference between 95 percent and the relevant female labour force participation rate. For example, given the information in Table 1, the earnings for females with post-secondary education could be estimated by reducing the earnings of comparable males by approximately 10 percent. Similarly, earnings for those with high school education might be obtained by reducing male earnings by approximately 15 percent.

Part-time employment

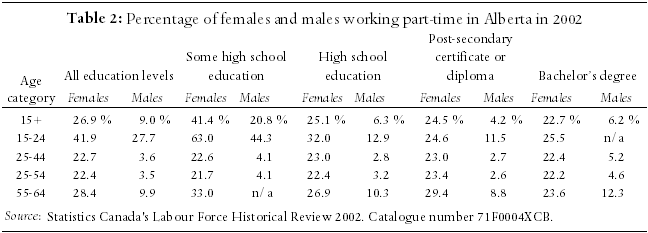
Even when they are in the labour force, women report lower annual incomes than men because they are more likely to work part-time. As Table 2 indicates, in the age group 25-54, approximately 20 to 25 percent of women work part-time, whereas only 2 to 5 percent of men do so. That is, on average, the number of women working part-time is approximately 20 percentage points higher than the number of men. If part-time is interpreted to mean “half time,” this implies that women in the labour force work 10 percent fewer hours than men. Everything else being equal, therefore, this difference suggests that male earnings should be reduced by a further 10 percent, in order to obtain an estimate of female earnings.

Table 2

Hours Worked

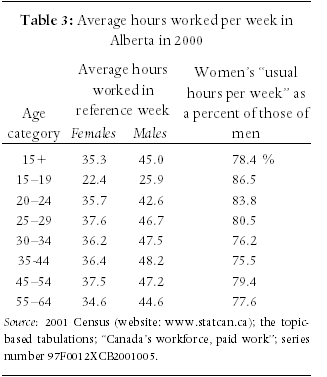
There is also evidence to suggest that, even among individuals who work “full-time,” women work fewer hours per week than do men. Table 3 indicates, for example, that women’s “usual hours per week” are about 80 percent of those of men. Furthermore, Sweetman [2] reports that this ratio varies only slightly by education level: in the age group 40-44, for example, the ratio of female to male hours worked is 81 percent for those with high school and 85 percent for those with a bachelor’s degree.

Table 3

It would be double-counting, however, to reduce male earnings by both 10 percent for part-time work and 15 to 20 percent for hours worked, as the latter differential includes the effect of the former. Rather, it appears that, among those individuals who work full time, women work 5 to 10 percent fewer hours than do men. It is this contingency that should be applied to male earnings.

Retirement

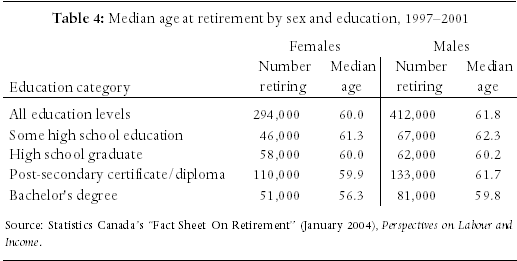
It is seen in Table 4 that women retire approximately two years earlier than men, on average. Hence, any estimate of female lifetime earnings will have to take this difference into account.

Table 4

Summary

Even if there was no discrimination in the labour market – that is, even if women received the same hourly wages as men – on average, women’s annual earnings would still be lower than men’s. Among those with high school education, the differential would be as much as 35 percentage points, due to differences in labour force participation rates (15%), propensity to work part-time (10%), and hours worked per week (10%). Among university graduates, the differential would be approximately 25 percentage points.

Accordingly, if it is concluded that women’s attachment to the labour market will not change in the future, women’s average annual earnings cannot be expected to rise above 65 percent (high school graduates) to 75 percent (bachelor’s degrees) of men’s earnings.

Only if women increase the percentage of their time that they devote to the labour market will that 25 to 35 percent differential begin to fall.

Application

How should these statistics be applied? We believe that two broad cases can be distinguished. In the first, the plaintiff was old enough at the time of her injury that it is possible to determine both the occupation she would have entered and the strength of her attachment to the labour market. (This was the situation in MacCabe, for example.) In those cases, information specific to the plaintiff should be used to predict her (non-injury) earning capacity.

In the second case, the plaintiff was young enough that neither her career nor her labour market attachment can be predicted. In such cases, we believe that information about the plaintiff’s family background is sufficient to allow the court to identify approximately what her educational attainment would have been. Census data concerning incomes by education can then be used to predict the plaintiff’s earning capacity.

But, is it census data for females, or for males, that should be used for this purpose? We have argued that, if the court believes either that labour force discrimination will largely disappear over the next few decades, or that the effects of discrimination should not be institutionalised in damage awards, it is male data that should form the basis of the award. However, the information we have presented in this paper suggest that, even in the absence of discrimination, women will earn less than men because of differences in attachment to the labour force. For that reason, we would propose that, for young females, the forecast of earnings capacity should be based on male data; but that those data should be adjusted downwards as we discussed above.

Footnotes

1. C.J. Bruce, Assessment of Personal Injury Damages (Butterworths: Toronto, Vancouver), fourth edition, 2004, page 167. [back to text of article]

2. Arthur Sweetman, 2002. “Working Smarter: Education and Productivity,” The Review of Economic Performance and Social Progress, in: Andrew Sharpe, Executive Director & France St-Hilaire, Vice-President, Research & Keith Banting, Di (ed.), The Review of Economic Performance and Social Progress 2002: Towards a Social Understanding of Productivity, volume 2 Centre for the Study of Living Standards. [back to text of article]

leaf

Christopher Bruce is the President of Economica and a Professor of Economics at the University of Calgary. He is also the author of Assessment of Personal Injury Damages (Butterworths, 2004).

Kelly Rathje is a consultant with Economica and has a Master of Arts degree (in economics) from the University of Calgary.