Winter 2003 issue of the Expert Witness newsletter (volume 8, issue 4)

Contents:

Policies to deal with rising premiums

by Christopher Bruce

In the first article in this newsletter, I analyzed the arguments concerning eleven possible sources of increased automobile insurance premiums. The purpose of this article will be to review each of those sources to determine whether there are changes in government policy that might reduce premium costs.

1. Number of accidents – Experience Rating.

The Alberta government has already taken one of the boldest and most innovative steps possible towards reducing the number of automobile accidents. This is their proposal to introduce experience rating – the direct tying of premium values to drivers’ accident-causing behaviour – to the automobile insurance sector.

Experience rating has two highly desirable characteristics. First, the individual driver has complete control over his or her premiums. If individuals drive cautiously, avoiding accidents and driving violations, their premiums will decline to the lowest available rate. Furthermore, individual drivers’ rates will not be relatively high just because they happen to belong to a group, like young males, that has a relatively high accident rate.

Second, there is a substantial body of statistical evidence to show that when insurance premiums are related to experience, accident rates fall. When individuals know that they can reduce their premiums significantly by driving more carefully, they do so.

Under the government’s proposal, the impact of a serious driving offence or an at-fault accident will be much greater than it is currently, under what is known as “actuarial” rating of premiums. For example, under the proposed system, a typical Edmonton driver who has recently begun to drive (i.e. who has no “experience”) will pay a premium of about $2,000. After four years of no accidents or driving offences, that driver will pay only $700 – a saving that will continue for each and every year into the future as long as the driver has no accidents or convictions. One would expect an annual saving of $1,300 to be of sufficient size that it would induce most individuals to take additional precautions against unsafe driving.

Furthermore, the proposed system would move the driver four steps up “the premium ladder” each time he or she had an at-fault accident. So the driver with four years of accident free driving would be bumped from the reduced $700 premium to the $2,000 base premium, losing the entire $1,300 “bonus”.

And the incentive to avoid driving convictions is even stronger. A single impaired driving conviction would increase premiums by 200 percent.

These proposals are highly desirable. The government deserves far more credit than it has received for recommending them. Nevertheless, the government needs to reconsider two aspects of its plan.

First, it is mistaken in its proposal that a government agency should set the base premium rate. For example, in the case discussed above, the $2,000 base premium for Edmonton drivers was not one chosen by the insurance companies, but by the government. This is unreasonable for two reasons. First, the government cannot know what the true cost is to the insurance companies of providing insurance. As a result, the base rate that it will choose is almost certain to be either too high or too low.

If it is too high, insurers will make excess profits at the expense of Alberta drivers. If it is too low, insurance companies will make losses and some of them will refuse to provide coverage to Albertans.

Second, when the government sets premiums, the competitive incentive for insurance companies to find ways to lower rates is lost. If insurance companies are forced to charge the same rates regardless of how efficient they are, there is less incentive for them to seek ways of being efficient. It is these competitive pressures that keep premiums from rising more than they have.

There is a simple solution to these problems: the government should set only the percentage increases and decreases that are to result from various “experiences” and leave the insurers to set the base rates from which those increases and decreases are to be calculated. This will get the government out of the business of setting rates, while leaving intact the strong incentives created by a system of experience rating.

The second problem with the new legislation is that it does not deal with the adverse incentives that it gives to insurance companies. Specifically, experience rating results in a situation in which insurers know they will make substantial profits on some classes of customers and lose money on others. Thus, it gives them a strong incentive to refuse to insure the money-losing group. In the scheme proposed by the Renner committee, that group will be composed primarily of young males.

Insurers will lose money on this group because the number of accidents drivers have had in the past is only loosely related to the number that they can be expected to have in the future. What decades of statistics tell us is that a nineteen-year-old male with a perfect, three-year driving record is more likely to have an accident in the next year than is a forty-year-old male with the same driving record. And a nineteen-year-old who had an accident last year is more likely to have an accident next year than is a forty-year-old with the same experience. This means that insurers will expect to pay out more claims to nineteen-year-old drivers than to forty-year-old drivers.

Assume, for example, that ten percent of nineteen-year-old drivers who have had a clean record for three years will have an accident in the next year; whereas only five percent of forty-year-olds with a similar record will have an accident next year. If the average accident costs the insurance company $10,000, it will expect to pay out an average of $1,000 for each nineteen-year-old and $500 for each forty-year-old.

If the government forces insurers to charge the two groups the same premium, they will have to charge something between $500 and $1,000 just to cover their expected claims costs. For example, if the two groups were the same size, the premium would be $750 (the average across the two). But this means that they will expect to make a $250 profit on the average driver in the older group and a $250 loss on the average driver in the younger group.

As insurance companies are profit-driven, we can expect that they will respond by doing their best to attract older drivers – and to turn away younger drivers. The stakes are high. Those companies that find themselves with a relatively high percentage of young drivers will lose money and will soon be forced out of the market. Companies will use every loophole at their disposal to attract as many drivers in the older age groups as possible.

For example, companies might offer to sell automobile insurance through employers, in much the same way they currently sell long-term disability and dental plans. As employees are predominantly in the 25-64 year age group, and as high risk drivers are predominantly in the 16-24 and 65+ age groups, such a practice would allow firms to “skim” off the low-claim drivers.

The government will need to introduce strict controls to ensure that companies are not seriously disadvantaged if they write insurance for groups whose average claims exceed average costs.

2. Severity of accidents – Improved policing.

Reductions in severity are most likely to come from improvements in the design of automobiles; and in the use of safety devices such as seat belts and air bags. Nevertheless, provincial governments can reduce severity by enforcing highway speed limits more strictly – particularly on segments of roads that are known to have high accident rates.

Recent scientific evidence, published in journals such as Accident Analysis and Prevention, Injury Prevention, and the Canadian Medical Association Journal, concludes that the two changes that offer the greatest promise for reducing the incidence and severity of accidents are: first, raising the legal drinking age; and, second, banning the use of hand-held cellular telephones by drivers of moving vehicles.

3. Damages – Restrictions on tort.

Many of the proposals that have circulated in the last year or so have had to do with the placement of restrictions on tort damages. In general, these proposals are based on the assumption that victims are currently being “overcompensated;” hence, a reduction in damages will not cause a hardship to victims. The two most commonly-made proposals are that individuals should not be able to claim from two insurers for the same loss – the “double compensation” issue – and that loss of income should be calculated net of income taxes – because victims do not have to pay taxes on their awards, they will be adequately compensated if damages are based on after-tax income.

Typically, double compensation occurs when the victim is compensated for loss of income both by the defendant and by the victim’s own long-term disability insurance. Under the new legislation in Alberta, victims will be allowed to collect from only one of these parties. This proposal seems reasonable except that it is usually suggested that the victim be required to collect from his or her own insurance company. Effectively this requires that the victim be made to pay for damages caused by a negligent driver – and it allows the negligent driver to evade responsibility for his/her actions. Neither of these outcomes seems defensible. Furthermore, if disability insurers are able to re-write their policies in such a way as to avoid paying damages when their clients are able to collect from negligent drivers, the legislation will affect only disability insurance premiums (which will decrease), not automobile insurance premiums.

The second proposal for reducing tort damages – that victims be compensated only for after-tax losses – also seems reasonable. As plaintiffs do not pay taxes on court-awarded damages, the payment of “gross” income overcompensates them. The primary argument against this proposal is that plaintiffs currently rely on this “overcompensation” to help them pay for their legal fees (which are only partially paid by the defendant). If plaintiffs have to pay for their legal fees out of after-tax income, their awards net of legal fees will leave them undercompensated.

A third element of the new legislation sets limits on the award of “non-pecuniary” damages. This is not based on the assertion that victims are being overcompensated by the courts. Rather, it is based on the assertion that victims of “minor” injuries are exaggerating their injuries and, therefore, defrauding the system. The issue of fraud is discussed in the next section.

4. Fraud.

Setting limits on damages is an entirely inappropriate method of dealing with fraudulent claims, primarily because it punishes the innocent. If fraud is an important factor in the determination of automobile insurance premiums, there are two appropriate responses. Insurers can increase their vigilance; and, in cases of egregious behaviour, they can ask the government to lay criminal charges. As both of these responses are already available to the insurance industry, the government does not need to take further steps.

5. Medical costs.

It is clear that public policy towards medical costs is unlikely to be influenced significantly by government concern over automobile insurance premiums. In this area, drivers and insurers can only hope that government health policy incidentally acts to reduce personal injury claims costs.

6. Legal costs – no fault.

It is often argued that legal costs could be minimized if a form of no fault insurance was introduced. Whatever the advantages of no fault might be, there are three important problems with it that must be dealt with before such a proposal can be considered seriously.

First, because more parties can make claims in a no fault system than in a fault system (“at fault” drivers can make claims in no fault systems but not in fault systems), there is very little chance that no fault will reduce premiums. Indeed, the evidence shows that no fault jurisdictions have premiums very similar to those in fault jurisdictions.

Second, the purported source of savings in a no fault system is that accident victims are denied access to the court system; hence legal bills are reduced. But, the courts serve an important function – they allow parties to appeal decisions made by their insurance companies that they feel are unfair. It is possible that an appeal system can be introduced to no-fault insurance, but there is some evidence to suggest that if such a system really is fair, it will cost as much as do the courts. In short, any savings in administrative costs tend to come at the expense of justice.

Third, there is consistent, strong evidence to suggest that there are more accidents in no fault jurisdictions than in fault jurisdictions because drivers in the former do not have to take responsibility for their actions. (Recent statistical studies conclude that when no fault insurance is introduced, the accident rate rises by approximately 6 percent.) Indeed, not only are the drivers who are at fault for their own injuries not made to pay higher premiums, they are fully compensated by the insurance system for any costs they incur.

7. Return on investment.

If insurance companies have been harmed by falling rates of return on their investments, there is nothing the government can do to help, short of making short-term loans at below-market rates.

8. Administrative costs – Public insurance.

It has often been suggested that administrative costs could be reduced if the private insurance system was replaced by a government-run monopoly. This suggestion ignores the fact that monopolies have been found, almost universally, (i) to be less responsive to their customers than are competitive firms; and (ii) to be less efficient than are firms that have to face competitive pressures. (Some proponents suggest that automobile insurance is less expensive in Saskatchewan and Manitoba than in Alberta because it is provided by monopoly in the former two provinces. However, this ignores the many subsidies that those insurers receive from their governments and also ignores the fact that British Columbia’s premiums are not significantly different from Alberta’s.)

9. Re-insurance.

Following the terrorist attacks of September 11, 2001, re-insurance companies have raised their premiums significantly. As the terrorist attacks should have only a negligible effect on automobile insurance claims, the re-insurers’ actions are unjustifiable. It might be appropriate for the Government of Alberta to provide re-insurance coverage to firms working within Alberta until re-insurance rates return to a level that is consistent with the risk that is being faced.

10. Collusion.

Unless some evidence is presented to suggest that automobile insurers are colluding, no action needs to be taken on this issue.

11. Statistics.

If Statistics Canada has overestimated the rate of increase of automobile insurance premiums and if premiums do follow a regular cycle, which is currently at its peak, then there is little or no rationale for the Alberta government to do anything about premiums. Alberta might cooperate with the Insurance Bureau and Statistics Canada in reassessing the method by which premium inflation is measured; but, otherwise, Alberta merely needs to wait a year or two and that inflation rate will fall significantly by itself. The drastic changes proposed by the government are completely out of line with the (non) seriousness of the situation.

Summary

This article has concluded that the government would be justified in adopting the following policy changes:

  • Introduce experience rating, as proposed by the Renner committee, but without government control over the base premium rate.
  • Increase police surveillance of moving traffic violations, particularly in areas identified as being of high risk.
  • Raise the legal drinking age.
  • Ban the use of hand-held cellular telephones by drivers of moving vehicles.
  • Introduce a regulation that losses of income be made on an after-tax basis.
  • Provide re-insurance to the automobile insurance industry until rates return to a level that can be justified based on expected claims.
  • Cooperate with Statistics Canada and the Insurance Bureau of Canada in investigating the manner in which the inflation rate of automobile insurance premiums is measured.

leaf

Christopher Bruce is the President of Economica and a Professor of Economics at the University of Calgary. He is also the author of Assessment of Personal Injury Damages (Butterworths, 2004).

Why have automobile insurance premiums been rising?

by Christopher Bruce

According to the most recent Statistics Canada data, automobile insurance premiums in Alberta increased by 68.6 percent between 2001 and 2003 (29.9 percent per year), at a time when the consumer price index increased by only 8.0 percent (3.9 percent per year). Similarly, over the 10-year period 1994-2003, premiums increased by 97.8 percent (7.9 percent per year) while the consumer price index increased by only 26.4 percent (2.6 percent per year). (See Figure 1.)

Although the government has reacted to this increase by introducing wide-ranging legislative changes, no satisfactory explanation has been given for why premiums should have risen so dramatically. The purpose of this article is (i) to review eleven of the explanations that have been given for rising premiums and (ii) to investigate those explanations to determine whether they are consistent with the evidence.

Figure 1

1. Number of accidents

Everything else being equal, an increase in the number of accidents per driver must increase insurance companies’ average payouts and, therefore, their average premiums. However, statistics indicate that the number of accidents has not increased significantly in the last decade. Between 1994 and 2001, for example, the number of collisions increased only from 431.4 to 460.5 per 10,000 vehicles, an average rate of increase of less than one percent per year. This cannot explain the sizeable premium increases of the last few years.

2. Severity of accidents

Even if the number of accidents had declined, the costs of claims per driver might have increased if the average severity of accidents had risen. If fewer people had been injured than in the past, but each injury had been much more serious than previously, total costs of claims might have risen.

With respect to severity, it is known that whereas the number of collisions involving injuries or fatalities increased only slightly between 1994 and 2001 – from 72 to 83 per 10,000 registered vehicles – and the number of collisions involving property damage remained almost constant – at about 360 per 10,000 registered vehicles – the number of “bodily injury” claims almost doubled – from 65 to 112 per 10,000 registered vehicles – over the same period. As bodily injury claims are generally much more expensive than other types, this trend suggests that the average cost of claims should have risen over the 1994-2001 period. Indeed, the Insurance Bureau reports that the average cost of injury claims rose by 44.6 percent (4.2 percent per year) between 1993 and 2002.

What these statistics do not explain, however, is why automobile insurance premiums increased so dramatically in 2002 and 2003. The statistics indicate that whereas the dramatic rise in premiums has been a recent phenomenon, the number and severity of bodily injury claims per vehicle has increased steadily for almost ten years. This evidence suggests that the recent rise in premiums is not closely connected with the increase in severity of accidents.

3. Damages

Even if the number and severity of accidents had remained constant, it is possible that the average cost of accidents could have risen if the courts had become more liberal in their awards of damages to accident victims. With respect to serious personal injury and fatal accident claims, the evidence on this question is clear, however – in the last 20 years there has been virtually no change in the manner in which the courts assess damages. Although there are no definitive statistics on this issue, the principles of damage assessment, in major injury cases, have not changed in Alberta since the mid-1980s. If damages for major injury cases have increased, it is not because there has been a change in the attitude of the courts; it is because Albertans’ incomes have been rising – necessitating larger awards to compensate victims for their losses of income.

It is possible that damage awards for minor injuries have increased substantially. However, it is noteworthy that insurance companies, who have argued that this is one of the major causes of increased premiums, have not released any data to back this claim. It seems reasonable to draw an adverse inference from this failure. Surely if the data supported the insurance industry’s arguments, they would have made those data public.

4. Fraud

Insurance companies commonly argue that consumer fraud is a major source of inflationary pressure on insurance rates. There are two major problems with this argument. First, although insurance fraud undoubtedly occurs, insurance companies have been unable to provide any statistically reliable evidence to show that fraudulent claims amount to more than a small percentage of payouts.

Second, and more importantly, even if fraud was a major problem, no evidence has been put forward to suggest that fraudulent claims have increased substantially in the last two years. For an increase in fraud to explain a significant portion of the 69 percent increase in premiums that has been observed, fraudulent claims would have to have increased dramatically. There is no evidence at all that this has occurred.

5. Medical costs

A recent study by the Insurance Research Council (a U.S.-based agency) found that “escalating medical costs are the key factor behind” the growth in automobile insurance claims in the past five years. It seems unlikely that this source could account for a significant portion of the recent rise in premiums in Alberta, however, as a substantial portion of medical costs resulting from automobile accidents are covered by Alberta Health Care. Since 1996, those costs have been covered under an annual levy that has increased at a relatively steady rate, of approximately 12 percent per year. For this source to explain a significant portion of the 69 percent increase in premiums seen in the last two years, there would have to have been a dramatic increase in the annual levy, an increase that has not been observed.

6. Legal costs

An additional component of the cost of insurance is the fees charged by lawyers and other experts. Although a substantial portion of victims’ legal fees are paid by the victims out of their damages – and, therefore, do not contribute to insurance companies’ costs – insurers have to hire their own lawyers and may sometimes have to pay a portion of the victims’ legal fees. Nevertheless, any argument that these costs have contributed to the substantial increase that has been observed in automobile insurance premiums founders on a lack of evidence that these fees have increased substantially in the last few years. It is one thing to argue that legal fees may, or may not, be “too high,” it is another thing altogether to argue that they have risen as a percentage of insurance costs.

7. Return on investment

To a certain extent the costs of operating an insurance company are offset by the company’s ability to invest the premiums it has received until drivers make their claims. The higher is the interest on those investments, the less does the company have to charge in the form of premiums. Some commentators have argued recently that the observed increase in premium costs has resulted from the decline in the average rate of return on investments.

This is not a compelling argument, however, as this decline cannot explain more than a small portion of the dramatic increases in premiums. If insurance companies hold premiums for half a year on average (that is, if premiums are collected at the beginning of the year and then spent at a constant rate over the year), and if the rate of return on investments is, say, 8 percent, then the interest that is collected will (on an annual basis) equal 4 percent of premiums. If the rate of return then declines to 5 percent, the effective return on the investment of premiums will fall to 2.5 percent, a drop of only 1.5 percent. As this is roughly the order of magnitude of recent declines in rates of return, this factor cannot explain a significant percentage of the recent increases in premiums.

8. Administrative costs

Approximately 25 to 30 percent of an insurance company’s costs are for administration – salaries of salespeople and adjusters, rent, cost of supplies, advertising expenses, etc. There is no evidence to suggest that these costs have risen significantly in the last few years.

9. Re-insurance

Insurance companies have argued that one of the most important sources of increased costs in the last two years has been the increase in premiums that they have had to pay to re-insurance companies since September 11, 2001. This argument is implausible. Figure 1 illustrates the increases in both automobile and homeowners’ insurance premiums in Alberta in recent years. If re-insurers had raised their rates in response to the perceived increase in terrorism, they would have raised those rates by at least as much for homeowners’ insurance as for automobile insurance. But it is seen clearly in Figure 1 that homeowners’ insurance premiums rose by far less than did automobile insurance premiums. This provides compelling evidence that increases in re-insurance premiums have not been a major source of the reported increase in automobile insurance premiums.

10. Collusion

Some critics of the insurance industry have argued that the recent increases in automobile insurance premiums have resulted from collusive behaviour among insurance companies. This argument is suspect for two reasons. First, it is difficult to explain why insurance companies would have raised premiums for automobile insurance and not for homeowners insurance. Second, there are more than 100 automobile insurance companies operating in Alberta. Over a century of experience suggests that it is extremely difficult even for an industry of only three or four firms to maintain a collusive stance. It is unlikely that 100 firms could do so.

11. Statistical interpretation

There is some concern that the dramatic increases that have been observed in automobile insurance premiums in the last few years have resulted from the way that statistics are collected and reported rather than from “real,” underlying factors. Two arguments have been made in this respect.

First, the Insurance Bureau argues that the manner in which Statistics Canada collects information about automobile insurance premiums produces misleading results. Nevertheless, the Bureau’s own data (published in the December 2003 issue of their newsletter Perspective) indicate that automobile insurance premiums in Alberta rose by approximately 63 percent (5 percent per year) between 1993 and 2003 and by approximately 30 percent (14 percent per year) between 2001 and 2003. Although these numbers are much lower than those produced by Statistics Canada, they are still substantially higher than the overall consumer price inflation figures for those periods. (Also, whereas Statistics Canada’s data measure changes in the price of a fixed “basket” of insurance policies, the IBC data measure changes in the costs of actual insurance policies that have been purchased. Thus, if, as premiums rise, consumers purchase less comprehensive policies, the IBC data will underestimate the rate of increase of given policies.)

Second, it is well known to observers of the automobile insurance industry that premiums move in a cyclical manner. When premiums are relatively low, insurers’ profits fall and many firms leave the market. This reduces competition and allows premiums to rise. But as that happens, profits also rise, attracting new firms, and driving down premiums again. Typically, this cycle takes approximately 10 years. The data in Figure 1 show, for example, that there were significant increases in premiums in the early 1980s, early 1990s, and early 2000s; and stagnation of premiums in the mid-1980s and mid-1990s.

This observation suggests that the recent, dramatic increases are simply part of a larger, cyclical movement in automobile premiums. Even if this is true, however, the average increase over the last 10 years – even when calculated on the basis of the IBC figures (5 percent per year) – has been more than double the average rate of consumer price inflation. Clearly, cyclical and statistical factors alone cannot account for this substantial increase.

Table 1

Conclusion

The information that has been reviewed in this paper suggests that two factors are primarily responsible for the pattern of premium changes that have been observed in Alberta in the last decade. First, the dramatic increases in the last two years represent a “natural” upturn in a long term cycle in premiums. Past patterns suggest that these increases will be followed by stagnation of premiums for the next six or seven years.

Second, there is some evidence to suggest that the average severity of personal injury claims has been rising. As I find no evidence that this increase has been due to fraud, to an increase in the number of accidents, or to changes in the criteria employed by the courts to calculate damages, it appears that the most plausible explanation is that the losses suffered by plaintiffs have been increasing in value.

leaf

A large number of individuals were kind enough to provide me with assistance in the preparation of this article. I would particularly like to thank Don Higa, Jim Rivait, Walter Kubitz, Derek Aldridge, and Harris Hanson.

Christopher Bruce is the President of Economica and a Professor of Economics at the University of Calgary. He is also the author of Assessment of Personal Injury Damages (Butterworths, 2004).

Autumn 2003 issue of the Expert Witness newsletter (volume 8, issue 3)

Contents:

  • How are Automobile Insurance Premiums Determined?
    • by Christopher Bruce
    • In this article Christopher Bruce Christopher Bruce provides a brief introduction to the process by which automobile insurance premiums are determined. He discusses actuarial rating, rating classes, and experience rating.
  • Economica’s Privacy Policy
    • by Christopher Bruce
    • This article provides a brief description of Economica’s privacy policy in light of Alberta’s Personal Information Protection Act.

How are Automobile Insurance Premiums Determined?

by Christopher Bruce

Although automobile insurance rates seem to be in the news constantly, there is often confusion in the media about the process by which premiums are determined. The purpose of this article is to provide a brief introduction to that process. Three topics will be discussed: actuarial rating, rating classes, and experience rating.

1. Actuarial Rating

In Alberta – and all jurisdictions with private insurance – automobile insurance premiums are established through a technique that is generally referred to as “actuarial rating.” Fundamentally, under this system the premium the driver pays is equal to the cost that the insurance company expects the driver will impose upon it. If, on average, insuring a driver will cost the insurer $1,000 per year, the premium it will charge will equal $1,000 (plus an allowance for the company’s profit margin).

Assume, for example, that an insurance company has 10,000 customers; that there is a 10 percent chance that each driver will have an accident that results in an insurance claim each year; and that the average claim is $7,000. On average, therefore, 1,000 customers will make a claim each year, imposing a total cost of $7,000,000 on the insurer. Spread across the company’s 10,000 customers, therefore, the cost of claims, per customer, is $700.

In addition, the insurer will have to pay for its own costs of administration and will have to collect enough money to provide it with at least the minimum amount of profit to keep its shareholders satisfied. Assume that administrative costs amount to $250 per customer per year and that the minimum “acceptable” profit level can be represented as $50 per customer per year.

In this case, the insurer will have to collect at least $1,000 per year from each of its clients – $700 to cover the average cost of accident claims, $250 to cover administrative costs, and $50 for profit. The theory of actuarial rating predicts that this insurance company will set its premiums equal to that $1,000 figure. The “proof” of the theory’s prediction is as follows:

First, imagine that the company was to set a premium that was higher than $1,000, say, $1,050. Now, the company’s expected profit would be $100 per customer (= $1,050 – $700 – $250), twice the $50 figure that insurance companies require in order to remain in business. A second insurer would see the opportunity to make substantial profits by offering to insure the first company’s clients for less than $1,050, say $1,025. At this rate, its profits of $75 per customer would still be higher than the $50 that shareholders demand. But this would attract additional companies who would be willing to offer an even lower rate. As long as profit exceeds the minimum necessary to attract investors – that is, as long as the premiums charged exceeded $1,000, new firms would continue to enter the market, driving the premium down. In the long-run, the premium rate could not remain above the cost of insurance plus the minimum profit level.

Second, imagine that the insurer was to set its premium below $1,000, say at $900. It would soon discover that the costs of insurance exceeded the premiums that were being collected and it would be forced either to raise its premiums or to go out of business. In either event, premiums would rise until they at least equaled insurers’ costs (plus the minimum profit level).

In short, as long as there is competition in the insurance market – that is, as long as firms are able to compete for the business of their rivals; and firms do not collude to prevent such competition – the premium level will always tend towards the cost of insurance plus a minimal profit level. When premiums are set in this way, they are called “actuarially fair.”

2. Rating “Classes”

In the preceding discussion, I assumed that each client had the same probability of making a claim – 10 percent per year. In reality, of course, some customers have a higher claims probability than others. The theory of actuarial rating predicts that insurers will attempt to identify different “classes” of customers, according to those customers’ claims probabilities, and will charge a premium to each group that is a function of its accident risk.

Assume, for example, that the insurance company discussed above realizes that 2,000 of its 10,000 customers have a higher-than-average probability of making an insurance claim, say 20 percent per year. If it is still assumed that the average probability across all 10,000 customers is 10 percent, that implies that the probability that each of the company’s remaining 8,000 customers will make a claim is 7.5 percent. That is, when the 2,000 high-risk customers each have an accident probability of 20 percent and the 8,000 low-risk customers have an accident probability of 7.5 percent, the average probability of an accident across the two groups together is 10 percent. Thus, the expected number of claims is still 1,000 per year – 400 (= 0.20 × 2,000) by the high-risk group and 600 (= 0.075 × 8,000) by the low-risk group.

If the company continues to charge each of its customers $1,000 per year, it will still make an average profit of $50 per customer. (Because its customers have the same number of accidents and pay the same premiums, the same amount is left over for profit). However, if another company notices what is happening, it will realize that it could make a higher profit than average by attracting away some of the first company’s low-risk drivers.

For example, if the second insurer was able to attract 1,000 customers by charging $900 to the low-risk group, it would find that, on average, 75 of those customers (= 0.075 × 1,000) would have accidents. At an average cost of $7,000 per accident, total accident costs would be $525,000, or $525 per client. Assuming that administrative costs remained at $250, this company’s total costs per client would be $775, leaving a $125 profit from the $900 premium.

Soon, other insurance companies would recognize this profit-making opportunity and they would also offer reduced premiums to the low-risk group. By the theory of actuarial rating, the equilibrium premium for drivers in that group would eventually settle at $825 – the $775 cost per driver plus $50 for profit.

At the same time, as low-risk drivers were being attracted away from the first company, that company would find itself with a higher and higher percentage of drivers from the high-risk group. Assume that, ultimately, all of its clients came from that group. If each of those drivers had a 20 percent probability of making a claim and the average claim cost $7,000, then the average value of claims per driver would be $1,400. When $250 is added to this figure for administrative costs and $50 for profit, the firm would have to charge a premium of $1,700 to each of these drivers to remain in business.

But, high-risk drivers have no incentive to reveal to insurers that they have high probabilities of making claims; and low-risk drivers may find it difficult to signal credibly that they are members of the low probability group. (If insurance companies offer low premiums to those in the low-risk group, it will be in every driver’s interest to claim to belong to that group.)

Hence, insurance companies have looked for ways to construct “classes” of drivers based on characteristics that can be observed readily. There are two types of such characteristics – those over which drivers have little or no control, like age, sex, and (to a lesser extent) area of residence; and those over which they have a significant amount of control, like number of “fault” accidents and number of moving violations.

Age and Sex

It is well known that young males – and, to a lesser extent, young females – have a higher probability of making claims against their insurers than do older drivers. In this sense, young males are similar to the high-risk group discussed in the preceding section.

For this reason, in a competitive market, insurers will be forced to charge higher premiums to young males than to other groups. An insurance company that averaged all drivers together when setting its premiums (for example, setting a single premium of $1,000 in the example above) would soon lose all of its low-risk drivers to other firms that offered those drivers premiums that were related to their expected costs ($825 in the preceding example).

Furthermore, even though some young males are low-risk drivers, they will be charged the high premiums associated with their group. The reason is that, from the insurance company’s perspective, all young males look alike. As long as they drive the same kinds of cars, have the same driving records, etc, insurers will be unable to determine which young males are low risk and which are high.

In a competitive insurance market, there is no way around this issue. Any insurance company that offered premiums that were less than its expected costs of covering young males would find, first, that it would attract a very large percentage of young male drivers and, second, that it would, on average, lose money on those drivers. It would soon be forced to change its policy or be driven out of business.

Driving Experience

A second way of classifying drivers into low-risk and high-risk groups is to observe their driving behaviours. For statistical reasons, it is known that those who have had accidents in the current year have a higher than average probability of having accidents in the next year than do those who did not have accidents in the current year.

Assume again that there are two groups of drivers – 2,000 high-risk drivers, who have a 20 percent probability of making a claim in any given year, and 8,000 low-risk drivers, who have a 7.5 percent probability of making a claim. Assume also that the insurance company is unable to determine, on the basis of characteristics such as age and sex, which drivers belong in each category. In that case, the average probability of an accident across the two groups is 10 percent and, in the first year, the actuarial insurance premium will be $1,000.

During the first year, however, 400 of the high-risk drivers and 600 of the low-risk drivers will have accidents. This means that, among the group “drivers who had an accident in year 1,” 400, or 40 percent of the group, have a 20 percent chance of having an accident in year 2 and 600, (60 percent), have a 7.5 percent chance. On average, the drivers in this group have a 12.5 percent chance of having an accident in year 2. Their actuarial premium, (the premium that covers their expected costs plus profit margin), will be $1,175.

The remaining group, “drivers who did not have an accident in year 1,” will be composed of 1,600 drivers from the high-risk group and 7,400 from the low-risk group. Their average accident risk in year 2 will be approximately 9.72 percent and their actuarial premium will be approximately $980.

What is seen here is that the reason there is a premium differential between drivers who have had accidents and those who have not is not because insurers are trying to “recover the payments” they have had to make on behalf of clients who had accidents. Rather, because the group “those who have had accidents” has a disproportionate number of high-risk drivers (because they are the most likely to enter this group), its expected claims costs must be above average – meaning that its premiums will be proportionately higher also.

This means that the premium differential between those who have had accidents and those who have not will increase as the size of the high-risk group increases (thereby increasing their representation in the “have had an accident” group) and as the risk differential between low- and high-risk drivers increases.

3. Experience Rating

Automobile insurance is designed to protect the purchaser from catastrophic loss. The consumer pays an annual premium in return for a promise from the insurer that the latter will pay for any losses incurred by the former.

But insurance also has a second, unintended effect – it reduces the incentive for drivers to avoid accidents. In the absence of automobile insurance, drivers would have to bear the full financial impact of any negligent behaviour – under the assumptions used in the preceding section that would be $7,000 for each accident. This threat could be expected to induce them to take precautions against such behaviour.

In the presence of automobile insurance, however, the financial impact of negligent behaviour is the difference between the premium charged to drivers who have had accidents and those who have not. In the preceding section, it was shown that this amount could be quite small – less than $200 under the plausible assumptions employed there. This significant reduction in financial risk (relative to the no-insurance situation) can be expected to reduce substantially the incentive to avoid negligent behaviour.

In response, many commentators have suggested that the current actuarial rating system should be replaced by one based on experience rating – that is, a system in which premiums are tied closely to occurrences of driver negligence. For example, insurance companies might be required to ensure that the premiums charged to drivers who had had accidents or serious moving violations were at least double those charged to drivers who had “clean” driving records.

Note that experience rating cannot arise independently in a market in which a large number of firms compete for customers. As was shown in Section 1, above, competition forces firms to charge premiums that are based on actuarial rating. Experience rating can only arise in markets in which there is no competition – such as in provinces like British Columbia and Saskatchewan in which the government has a monopoly – or in jurisdictions in which the government establishes legislation to force private insurers to use that rating system.

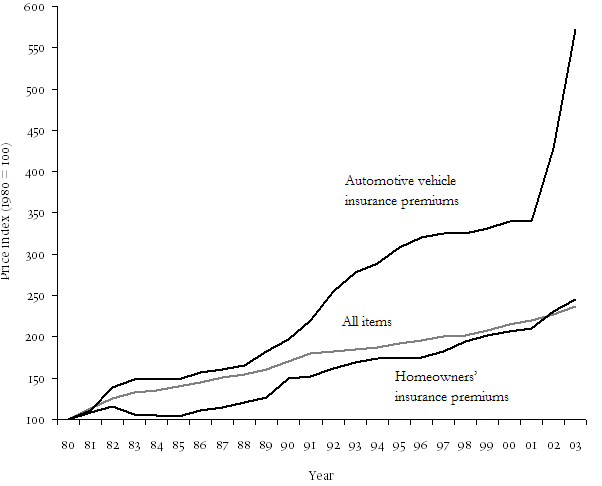
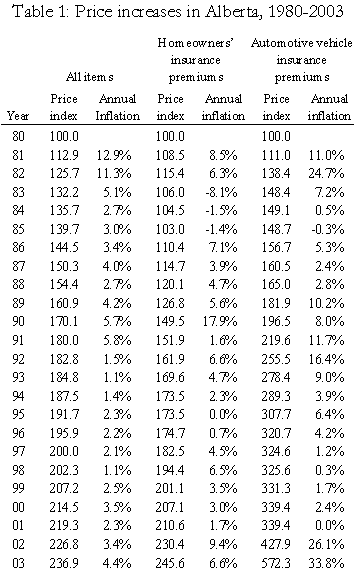
Among the legislative changes that were contained in Alberta’s recent Bill 53, (see www.autoinsurance.gov.ab.ca/calculate.html), is a proposal to impose a version of experience rating. Although binding regulations have not been announced yet, the current proposal would require that insurers increase premiums by as much as 50 percent in the year following a single “at fault” claim and by an additional 30 to 40 percent in each subsequent year for six years or more; (that is, by as much as 250 percent when added across the six years following a single claim). The proposed system would also require that insurers increase premiums by 200 percent in each of the two years following a criminal code violation – such as impaired driving or criminal negligence causing death.

Economic theory predicts that experience rating systems – such as the one proposed by the Alberta government – will produce substantial increases in the levels of precautions taken by drivers – and corresponding substantial decreases in the number of accidents. It will be interesting to observe (i) whether the Alberta government will have the political willpower to force such a restrictive rating system on an unwilling and politically powerful insurance industry; and (ii) if it does so, whether such a system will yield the anticipated benefits.

leaf

Christopher Bruce is the President of Economica and a Professor of Economics at the University of Calgary. He is also the author of Assessment of Personal Injury Damages (Butterworths, 2004).

Summer 2003 issue of the Expert Witness newsletter (volume 8, issue 2)

Contents:

  • Assessment of damages in wrongful birth cases
    • by Gerald Robertson, Q.C.
    • Gerald Robertson is a Professor of Law at the University of Alberta, and a practising barrister and solicitor in the areas of civil litigation and personal injury. He is co-author of Legal Liability of Doctors and Hospitals in Canada (3rd ed.). He is also a director of the Robertson Personal Injury Newsletter, an on-line weekly digest of all personal injury judgments in Canada decided over the previous week, along with current developments in the area of personal injury litigation.
  • Predicting post-secondary education attainment
    • by Mohamed Amery
    • In this article Mohamed Amery discusses cases involving plaintiffs who are minors, in which it is necessary to predict the level of education that these individuals would have obtained had they not been injured. Mr. Amery’s article provides information concerning indicators that can be used to make this prediction – including the education of the plaintiff’s parents; the level of the plaintiff’s employment while in high school; and whether the plaintiff ever failed a grade.
  • The impact of parental divorce or death on adolescents’ education & earnings
    • by Christopher Bruce & Mohamed Amery
    • In this article Christopher Bruce and Mohamed Amery survey recent research concerning the impact that the death or divorce of a parent will have on the lifetime earning capacity of children.
  • Experience-Rating of Automobile Insurance: A Good Idea that Won’t Work
    • by Christopher Bruce
    • In this article Christopher Bruce identifies some of the weaknesses of legislation that requires automobile insurance companies to use “experience rating” – a system in which the only factor that determines your premiums is your driving record.

Experience-Rating of Automobile Insurance: A Good Idea that Won’t Work

by Christopher Bruce

This article first appeared on page A21 of the October 16, 2003 Calgary Herald, and then in the summer 2003 issue of the Expert Witness.

Imagine you have two drivers who drive the same kind of car, live in the same city, and have the same driving record over, say, the last three years. Doesn’t it make sense that they should pay the same automobile insurance premiums?

Apparently, it made sense to the provincial government’s Automobile Insurance Reform Implementation Team. Yesterday, they recommended legislation that will require automobile insurance companies to use “experience rating.”

In a nutshell, experience rating refers to a system in which the only factor that determines your premiums is your driving record. All drivers who have no “experience” of accidents, speeding violations, drunk driving charges, etc. pay the same, relatively low base premium. Then, as they experience one or more of these events, their premiums rise accordingly – and, as they have additional years in which they do not experience these events, their premiums decline.

Experience rating has two highly desirable characteristics. First, the individual driver has complete control over his or her premiums. If you drive cautiously, avoiding accidents and driving violations, your premiums will decline to the lowest available rate.

Most importantly, your rate will not be higher than anyone else’s just because you happen to belong to a group, like young males, that has a relatively high accident rate.

Second, it has been shown consistently that when insurance premiums are related to experience, accident rates fall. When individuals know that they can reduce their premiums significantly by driving more carefully, they do so. And, of course, if the number of accidents decreases, so will insurance premiums.

It seems like experience rating is a win-win proposition. If so, then why hasn’t it been introduced before? The simple answer is that it results in a situation in which insurers know they will make substantial profits on some classes of customers and lose money on others. Thus, it gives them a strong incentive to refuse to insure the money-losing group.

In the scheme proposed by the government, that group will be composed primarily of young males.

Insurers will lose money on them because the number of accidents a driver has had in the past is only loosely related to the number that they can be expected to have in the future. What decades of statistics tell us is that a nineteen year-old male with a perfect, three-year driving record is more likely to have an accident in the next year than is a forty-year old male with the same driving record.

And a nineteen year-old who had an accident last year is more likely to have an accident next year than is a forty-year old with the same experience.

This means that insurers will expect to pay out more claims to nineteen year-old drivers than to forty year-old drivers.

Assume, for example, that 10 percent of nineteen year-old drivers who have had a clean record for three years will have an accident in the next year; whereas only 5 percent of forty year-olds with a similar record will have an accident next year. If the average accident costs the insurance company $10,000, then it will expect to pay out an average of $1,000 for each nineteen year-old and $500 for each forty year-old.

If the government forces insurers to charge the two groups the same premium, they will have to charge something between $500 and $1,000 just to cover their expected claims costs. For example, if the two groups were the same size, the premium would be $750 (the average across the two).

But this means that they will expect to make a $250 profit on the average driver in the older group and a $250 loss on the average driver in the younger group.

As insurance companies are out to make profits, we can expect that they will respond by doing their best to attract older drivers – and to turn away younger drivers.

The stakes are high. Those companies that find themselves with a relatively high percentage of young drivers will lose money and will soon be forced out of the market. Companies will use every loophole at their disposal to attract as many drivers in the older age groups as possible.

Advertising will be focused on older drivers – ads will appear primarily in magazines that appeal to middle-aged consumers, for example, and music in TV ads will be taken from the 1960s. Agents will be instructed to make it difficult for younger drivers to obtain insurance. And incentives, like toaster ovens for new clients, will be offered that will appeal primarily to older drivers.

The result is that the government will have to introduce ever-stricter regulations, to ensure that all drivers are able to obtain insurance. It will be interesting to see whether this degree of interference in the private sector is something that a market oriented government is willing to countenance.

leaf

Christopher Bruce is the President of Economica and a Professor of Economics at the University of Calgary. He is also the author of Assessment of Personal Injury Damages (Butterworths, 2004).

The impact of parental divorce or death on adolescents’ education & earnings

by Christopher Bruce
& Mohamed Amery

This article first appeared in the summer 2003 issue of the Expert Witness.

It is sometimes argued that individuals’ earnings will be lower if they grow up in single parent homes than in homes with two parents. If this argument is correct, it is possible that the loss of earnings experienced by a child who has been injured will be lower if that child came from a one-parent family than from a two-parent family. Conversely, however, the loss suffered by a child whose parent has been killed may be higher than would normally be assumed if the loss of that parent has meant that the child must now grow up in a single-parent family.

A number of studies are available that have explored the effect of parental absence due to divorce or death on adolescents’ labour market outcomes as adults. Although these studies are consistent in finding that the absence of a parent has some effect on adult earnings, they disagree on what that effect is. Corak, for example, concluded that whereas the earnings of women were the same regardless of family backgrounds, those of men from divorced families were approximately three percent lower than those of men from intact families.

Lang and Zagorsky confirmed Corak’s finding that “parental presence early in life [has only a minor effect on] economic well-being in adulthood” (p. 255). Nevertheless, whereas they found that a father’s presence is important for the educational attainment of both sons and daughters, a mother’s presence is significant only for the educational attainment of daughters. Also, contrary to Corak, they found (p. 255) a “strong impact of father’s presence on [a] son’s probability of being married”.

Fronstin et. al. concluded that the wages of “females, but not males, appear to be adversely affected by a father’s death, particularly when the death occurs before the child’s sixteenth birthday” (p. 151). The primary impact on men was higher unemployment rates (at age
33), particularly if the father had died when the son was between 16 and 22. Fronstin et. al. also found that disruptions occurring prior to “middle teenage years have somewhat greater adverse effects on educational attainment, while disruptions occurring into young adulthood have [their primary] adverse effects on … labour market outcomes” (p.
168).

In their book, Growing Up with a Single Parent, Sara McLanahan and Gary Sandefur, summarized the findings of a number of studies that had been conducted in the 1980s. Those studies generally found that children who were raised in single-parent families were somewhat less likely to attend college than were children of two-parent families, and much less likely to graduate from college. However, there was clear evidence that these effects were much less severe if one parent had died than if the child’s parents had divorced or had never married. These results suggest that it is not “single-parenting” per se that yields adverse effects. Rather, single parenting appears to act as a proxy for the underlying factors that lead parents not to marry, or to divorce. It is those unobserved factors that appear to have the primary impact on children’s labour market success.

Finally, Boggess found that living with a widowed, divorced, or separated mother had no effect on educational attainment. Interestingly, however, he concluded that “living in a stepfather family appears to have a persistent negative effect on high school graduation rates” (p. 205).

What these studies appear to suggest is that a child from a single-parent family may obtain slightly less education, and perform slightly less well in the labour market, than a child from a two-parent family. However, this effect will be much more pronounced if the child’s parents had never married or had divorced than if one of the child’s parents had died.

References

Boggess, S. (1998) “Family Structure, economic status, and Educational Attainment” 11(9) Journal of Population Economics,
205
222.

Corak, Miles (2001), “Death and Divorce: The Long-term Consequences of Parental Loss on Adolescents” 19(3) Journal of Labor Economics,
682-715.

Fronstin, P. et al. (2001) “Parental Disruption and the Labour Market Performance of Children When they Reach Adulthood” 14(4) Journal of Population Economics, 137 – 172.

Lang, K. and J. L. Zagorsky (2000) “Does Growing Up With a Parent Absent Really Hurt?” 36(2) The Journal of Human Resources, 253-272.

McLanahan, S., and G. Sandefur, Growing up with a Single Parent (Cambridge, Mass.: Harvard University Press), 1994.

leaf

Christopher Bruce is the President of Economica and a Professor of Economics at the University of Calgary. He is also the author of Assessment of Personal Injury Damages (Butterworths, 2004).

Mohamed Amery was a research assistant with Economica and an honours economics student at the University of Calgary.

Predicting post-secondary education attainment

by Mohamed Amery

This article first appeared in the summer 2003 issue of the Expert Witness.

When the plaintiff is a teenager, the first step in predicting that individual’s without-accident earnings capacity is to predict the level of education that would have been achieved by that individual. A recent study, by George Butlin of Statistics Canada, provides a considerable amount of new information concerning the factors that determine whether a high school graduate will enter trade-school, college, or university.

One of the most important of these factors is the education of the parents. Whereas 70 percent of high school graduates with at least one university educated parent attended university, only 43 percent of graduates whose parents had college or trade-vocational level education did so. At the same time, of the graduates whose parents had less than or equal to a high-school education level, only 30 percent participated in university. Conversely, just 18 percent of graduates whose parents were university educated attended a community college.

Butlin also found that, of high-school graduates who failed a grade in elementary school, only 11 percent attended university. This figure is significantly lower than the 46 percent university attendance rate for those who did not fail an elementary grade. He hypothesised that “failing a grade in elementary school may be an indicator of a range of problems beyond academic difficulties [such as] family problems, behavioural problems, psychological problems, language problems, and so forth.” That is, the same factors that resulted in students’ failing elementary grades were also at work in deterring students from entering university.

High-school graduates from two-parent families were found to be more likely to attend university than those from lone-parent households. However, Butlin also found that there were no major differences between two-parent and lone-parent families regarding a graduate’s participation in college or trade-vocational schooling. Those from rural areas were also found to have a lower likelihood of attending university than those from urban areas (34 percent versus 45 percent).

Finally, Butlin found that participation in extra-curricular activities while in high-school acted as a predictor of enrolment at university. High school graduates who had either worked at a job for less than 20 hours per school week throughout their high school years, or who had not worked during their last year of studies at all, had a 45 percent likelihood of attending university. Whereas, of those students who had worked more than 20 hours per week, only 27 percent proceeded onto university schooling. This is not to say that working while in high school “causes” students to choose educational streams other than university. Rather, a more plausible hypothesis is that students who do not intend to enter university take their high school studies less seriously than do those who plan to continue their education and, hence, have more time available for work. Nevertheless, participation in extra-curricular activities can be an important piece of information when predicting the post-secondary education of teenagers.

Reference

Butlin, G. (1999), “Determinants of Postsecondary Participation” 5(3) Education Quarterly Review (Ottawa: Statistics Canada, Catalogue No. 81-003), 9-35.

leaf

Mohamed Amery was a research assistant with Economica and an honours economics student at the University of Calgary.

Assessment of damages in wrongful birth cases

by Gerald Robertson, Q.C.

This article first appeared in the summer 2003 issue of the Expert Witness.

Wrongful birth lawsuits are certainly not new in Canada – they have been around for over 25 years1 – and yet many of the fundamental issues relating to assessment of damages in these cases still remain unclear. This type of lawsuit arises in a variety of factual contexts. They include failed sterilization or abortion, negligence in prescribing contraceptives, and negligence in prenatal care or counselling. Although the factual contexts vary, all wrongful birth actions share the same essential characteristic: but for the defendant’s negligence, the child would not have been born.2

The following example is fairly typical. A married couple with four children decide that they do not want to have any more. One of the spouses undergoes a sterilization operation, but due to the negligence of the doctor the operation is unsuccessful, and a fifth child is subsequently born. What damages can the parents claim? In particular, can they claim the cost of raising the child to the age of majority, or beyond? What if the child is born with disabilities: how does that affect the assessment of damages?

Based on recent cases, both from Canada and elsewhere, it is clear that one of the key issues in wrongful birth cases is whether the child is born healthy or disabled.

Healthy Children

The initial reaction of most courts (including Canadian) in wrongful birth cases was that it would be contrary to public policy to award damages for the cost of caring for a healthy child.3 However, this position changed in Canada in the 90’s (although much earlier in England)4, with a number of Canadian cases awarding substantial damages under this head.5 However, in recent years that position has changed. In particular, in 1999 the House of Lords in the case of McFarlane v. Tayside Health Board6 held that in wrongful birth cases involving a healthy child, no damages should be awarded for the cost of caring for the child to the age of majority. McFarlane did recognize that damages ought to be awarded for a number of various items, and this has been followed in subsequent Alberta cases.7 These include items such as pain and suffering during pregnancy, labour and delivery, and loss of income during pregnancy and for a reasonable period after the birth.

The reaction to McFarlane in other countries has been mixed. In Canada, there have been a number of recent cases (including those from Alberta) which have adopted its position that no damages should be awarded for the cost of caring for a healthy child.8 Indeed, in Alberta it has been held that, even if the cost of future care were claimable, it would be almost entirely offset by government benefits.9

However, one recent Alberta case – M.S. v. Baker10 – has taken a different view, holding that cost of care damages should be awarded if financial reasons influenced the parents’ decision to have no more children.11 In addition, the High Court of Australia (Australia’s highest court), in a decision rendered in 2003,12 declined to follow McFarlane. Therefore, overall the position in Canada remains unclear.

Disabled Children

Most courts, even those who have denied damages for the cost of raising a healthy child, have accepted that these damages should be awarded if the child is born with disability.13 This type of case usually arises in the context of prenatal (or preconception) counselling or care; for example, where a woman is not informed of the risk of fetal abnormality associated with the woman’s medical condition or genetics, thereby preventing the woman from making an informed choice as to whether or not to initiate or terminate a pregnancy. The recent case of Arndt v. Smith14 provides a useful example. In that case the defendant doctor was held to have been negligent in failing to advise the patient of the risk of serious fetal abnormality arising from her having contracted chicken pox during the 12th week of pregnancy; the baby was born with severe disabilities.

The Supreme Court of Canada has recently addressed the question of assessment of damages in wrongful birth cases involving disabled children. In Krangle v. Brisco15the doctor responsible for prenatal care negligently failed to advise the patient of her increased risk of having a Down’s Syndrome child. The child was subsequently born with Down’s Syndrome. It was accepted that the parents were entitled to damages for non-pecuniary loss for the pain and suffering associated with giving birth to, and raising, a disabled child. Other items which were not in dispute included the cost of care to the age of majority. However, the contentious issue was whether the parents were entitled to damages for the cost of caring for the child beyond the age of majority. The Supreme Court held that they were not.16

It should not necessarily be assumed that the Krangle decision applies in all provinces, even though it is a decision of the Supreme Court of Canada. The reason for this is that the decision is based on the particular wording of the British Columbia legislation, under which parents are not legally responsible to care for their children after the age of majority,17 even if the child is disabled. In many other provinces, such as Alberta,18 the statutory position is different, and parents are legally obliged to care for their disabled children after the age of majority. Hence, in those provinces, a claim for cost of care after majority may well be available, despite the decision in Krangle.

Footnotes

1. The earliest cases include Colp v. Ringrose (1976) 3 L. Med. Q. 72 (Alta. T.D.); Doiron v. Orr (1978) 86 D.L.R. (3d) 719 (Ont. H.C.); and Cataford v. Moreau (1978) 114 D.L.R. (3d) 585 (Que. S.C.). [back to text]

2. See generally, E.I. Picard & G.B. Robertson, Legal Liability of Doctors and Hospitals in Canada (3rd ed., 1996) at 212-217. [back to text]

3. See Colp v. Ringrose, supra note 1; Doiron v. Orr, supra note 1. [back to text]

4. See in particular Emeh v. Kensington & Chelsea & Westminster AHA [1985] 2 W.L.R. 233 (C.A.). [back to text]

5. See, for example, Joshi v. Wooley (1995) 4 B.C.L.R. (3d) 208 (S.C.); Suite v. Cooke [1995] Q.J. No. 696 (C.A.). [back to text]

6. [2000] 2 A.C. 59 (H.L.). [back to text]

7. M.Y. v. Boutros [2002] A.J. No. 480 (Q.B.). [back to text]

8. See, for example, M.Y. v. Boutros, supra note 6; Mummery v. Olsson [2001] O.J. No. 226 (Super. Ct.). [back to text]

9. M.Y. v. Boutros, supra note 6. [back to text]

10. [2001] A.J. No. 1579 (Q.B.). [back to text]

11. The Court followed the reasoning in the Ontario case of Kealey v. Berezowski (1996) 30 O.R. (3d) 37 (Gen. Div.). For a critique of the Kealey decision see Picard & Robertson, supra note 2, at 215. The reasoning in Kealey was expressly rejected in M.Y. v. Boutros, supra note 6. [back to text]

12. Cattanach v. Melchior [2003] H.C.A. 38. [back to text]

13. For Canadian cases see H.(R.) v. Hunter (1996) 32 C.C.L.T. (2d) 44 (Ont. Gen. Div.); Cherry v. Borsman (1992) 94 D.L.R. (4th) 487 (B.C.C.A.), leave to appeal to S.C.C. refused (1993) 99 D.L.R. (4th) vii (S.C.C.). See also Rees v. Darlington Memorial Hospital NHS Trust [2002] E.W.J. No. 582 (C.A.). [back to text]

14. (1997) 148 D.L.R. (4th) 48 (S.C.C.). See also E. Nelson T. Caulfield, “You Can’t Get There From Here: A Case Comment on Arndt v. Smith” (1998) 32 University of British Columbia Law Review 353. [back to text]

15. [2002] 1 S.C.R. 205. [back to text]

16. For later B.C. cases on the same issue see Zhang v. Kan [2003] B.C.J. No. 164 (S.C.); Jones v. Rostvig [2003] B.C.J. No. 1840 (S.C.). [back to text]

17. Family Relations Act, R.S.B.C. 1996, c. 128. [back to text]

18. Maintenance Order Act, R.S.A. 2000, c. M-2, s. 2. [back to text]

leaf

Gerald Robertson is a Professor of Law at the University of Alberta, and a practising barrister and solicitor in the areas of civil litigation and personal injury. He is co-author of Legal Liability of Doctors and Hospitals in Canada (3rd ed.). He is also a director of the Robertson Personal Injury Newsletter, an on-line weekly digest of all personal injury judgments in Canada decided over the previous week, along with current developments in the area of personal injury litigation. More information about the Robertson Personal Injury Newsletter can be found at www.rpin.ca.

Spring 2003 issue of the Expert Witness newsletter (volume 8, issue 1)

Contents:

  • Selecting the Discount Rate – An Update
    • by Christopher Bruce, Derek Aldridge, Kelly Rathje, and Scott Beesley
    • This article extends the work done by us in issues 5(3) and 6(4) of The Expert Witness, we conclude that it would be appropriate to revise our existing 2½ and 3½ percent two-part forecast of real interest rates. We propose to use a rate of 2¼ percent for the first five years of all calculations. For all subsequent years we propose to use a rate of 3¼ percent.
  • Retirement trends in Canada
    • by Kelly Rathje
    • This article compares retirement ages of Canadians over the five year period 1991-95 to retirement ages of Canadians over the five year period 1996-2000. The findings show that for most educational and industry categories, Canadians are retiring earlier than they did even five years ago.

Retirement trends in Canada

by Kelly Rathje

This article first appeared in the spring 2003 issue of the Expert Witness.

The value of an individual’s potential earning capacity depends in part on how long she will be in the labour force. That is, for the calculation of lost earnings, it is necessary to make assumptions concerning the age at which the individual would have retired (and will now retire).

The focus of this article is to compare retirement ages of Canadians over the five year period 1991-95 to retirement ages of Canadians over the five year period 1996-2000.* The findings show that for most educational and industry categories, Canadians are retiring earlier than they did even five years ago.

In the early 1980s, the median retirement age was close to age 65. However, retirement ages decreased steadily from 1986 to approximately 1993. Notably, in 1987, the Government of Canada reduced the age (from age 65 to age 60) at which Canada Pension Plan benefits could be collected (albeit with a reduced pension amount). I compare the retirement patterns of Canadians over the 1991-95 period to the retirement patterns of Canadians over the 1996-2000 year period to see if the trend for earlier retirement has continued. In Table 1, the distribution of retirement ages in Canada over the two five-year periods (1991-95 and 1996-2000) is summarized.

As shown in Table 1, in the five year period 1991-95, the highest percentage of individuals retired in the 60 to 64 year age category. In the five year period 1996-2000, 60 to 64 still remained the most popular age group for retirement, however the percentage of individuals retiring within the age category had dropped by 6 percentage points (37 percent to 31 percent). The percentage of individuals retiring “earlier”, in the 50 to 54 age category and 55 to 59 age category both increased – the former having the largest increase (9 percent to 15 percent, or 6 percentage points). This suggests that although many Canadians are still choosing to retire at a “normal” retirement age (60 to 64), there is a shift to earlier ages.

Table 1

Although the percentage of people retiring in their 60s decreased within the time period considered, the percentage of individuals retiring at age 70 or above remained unchanged.

Table 2 compares median retirement ages in Canada over the periods 1991-95 and 1996-2000. (The “median” retirement age is defined such that 50 percent of individuals retire at ages above that age and 50 percent below it.)

As shown in Table 2, the overall median retirement age has decreased by one year, from approximately age 62 (1991-95) to 61 (1996-2000). The median retirement ages of private employees also decreased by one year (from age 63 to age 62), however the retirement ages of public employees decreased by two years (from 60 to 58). Self-employed individuals experienced no change in retirement trends from 1991-95 to 1996-2000. The earlier retirement ages of public employees are likely due to the generous pension plans available to most public employees, which often offer incentives to retire at earlier ages.

Table 2

Table 3 summarises retirement ages by industry. As shown in the table, many industry categories also experienced decreases in median retirement ages between 1991-95 and 1996-2000. However, self-employed individuals did not alter their retirement patterns in most industries and, if anything, the retirement age of self-employed individuals may be increasing.

Table 3

Considering the “employees” category for the goods-producing occupations, retirement ages remained constant for all industries except for utilities and construction. These two experienced a decline in retirement ages of 2 years. For service-producing industries, all declined except management, which remained constant at 65. Educational services showed the largest decline in retirement ages over the two five year periods – from age 61 to age 57, a drop of four years. This may have resulted from restructuring within the education sector that led to the offering of early retirement packages to many teachers. If so, there may be a reversal of this decline in the future (as fewer early retirement incentives are offered).

Self-employed individuals again show higher retirement ages than employees. Within the goods-producing industries, most show an increase in the age of retirement (there was a decline in manufacturing), which goes against the overall trend for retirement patterns of Canadians. The service-producing industries, however, showed a one year decrease in retirement ages for the trade, management, and other industries; constant retirement ages for transportation and professional industries; and a one year increase in retirement ages for health care and accommodation industries. The largest increase was in the finance, insurance, and real estate industries, which saw a four-year increase in retirement ages over 1991-95.

The above tables show retirement trends by industry, and the statistics combine both male and female statistics, and also do not consider specific levels of education. The statistics for males and females, by education levels are summarized in Table 4.

Table 4

Over 1991-95, men and women overall had similar retirement patterns. That is, there was only one year difference in the retirement ages at each education level. In 1996-2000, the male retirement patterns saw very little change from 1991-95, with most education levels having unchanged retirement ages. Only males at the high school diploma level experienced a decline in retirement (age 61 to 60).

Females, on the other hand, have followed a decline at each level by at least one year. Females with a university education resulted in the lowest median retirement age (57) over 1996-2000. Also note that at the high school diploma level, males and females experienced the same retirement age (60).

I note, however, that the female retirement trends may be underestimated. Retirement trends are based on historical retirement, and may not reflect the trends of future generations. That is, young women in the labour force now may experience different retirement patterns than women who were of retirement age in the last five years. The current generation of women are obtaining higher levels of education, and are participating in the labour force more, as compared to those women of retirement age now. This suggests that their labour force attachment may be greater than the attachment of the older cohorts. Therefore, it may be theorized that young women now in the labour force will retire later than women who faced the retirement decision in recent years.

Also, there is evidence to suggest that in the future, there may be pressure for Canadians, both male and female, to delay retirement. For example, in a paper entitled “Future Age of Retirement”,** Brown argued that as the baby boom generation moves into the retirement ages, they will attempt to liquidate assets in order to buy goods and services. This will reduce the value of the assets due to the number of retirees attempting to do this. Also, the smaller “baby bust” generation will be the source of labour within the economy. The production in the economy may slow due to the smaller labour force, resulting in price inflation. This may force some potential retirees to postpone retirement since the value of their assets will have decreased. Thus, Brown’s prediction for retirement in Canada is that the median retirement age will fluctuate between age 60 and 61 over the next 47 years. That is, the overall median age of retirement and the trend of decreasing retirement ages may not continue on into the future.

Conclusion

Based on the above information, it seems that the median retirement age in Canada has fallen from age 62 to 61 and, depending on educational attainment and gender, the average retirement of an individual may be as low as 57, or as high as 65. Self-employed individuals continued to retire at approximately age 65.

For the purposes of loss of income calculations, it seems reasonable to consider the education level of the individual, since there are statistics available for both males and females. In addition, if a career path has been established, one should also consider retirement patterns of the specific industry. For minors, the overall or educational statistics would be appropriate.

Footnotes

* The source of the data provided in this article is the Statistics Canada publication Perspectives on Labour and Income, Summer 2002 Vol. 14, No. 2, and Summer 1997 Vol. 9, No. 2. [back to text of article]

** Brown, Robert L. “Future Age of Retirement” Canadian Investment Review, Fall 2002, pages 32-37. [back to text of article]

leaf

Kelly Rathje is a consultant with Economica and has a Master of Arts degree (in economics) from the University of Calgary.

Selecting the Discount Rate – An Update

by Christopher Bruce, Derek Aldridge, Kelly Rathje, and Scott Beesley

This article first appeared in the spring 2003 issue of the Expert Witness.

In the Autumn 2000 issue of this newsletter, we conducted an extensive review of the various methods of measuring the real rate of interest, or discount rate, and presented evidence concerning the movement of those measures over the period 1995-2000.

That survey was subsequently updated in our Winter 2001/2002 issue (Vol. 6, No. 4). What we found was that interest rates had begun to fall, relative to the historically high levels that had persisted over most of the 1990s.

At that time, we concluded that the best estimate of the long-run discount rate was 3½ percent. But we also argued that, as interest rates on short-term bonds and GICs were lower than those on longer term investments, it would be appropriate to employ an interest rate of 2½ percent on the first five years of any investment.

The purpose of this article will be to provide five additional quarters (15 months) of data to determine whether the trend we observed at the beginning of 2002 has continued, or whether a revision in our recommended interest rate is appropriate.

Revised data

Tables 1 and 2 provide updates of the information contained in the equivalent tables of the Winter 2001/2002 article. In particular, we have added data for all four quarters of 2002 plus the first quarter of 2003.

Table 1 reports the “raw” data from which some of the real interest rate figures in Table 2 have been calculated. The first column reports the “core rate of inflation” – a measure of the rate of inflation that removes the effects of change in those components of the price index that often move erratically, such as food, energy, and taxes. It is often argued that this measure offers a more reliable predictor of future changes in prices than does the “standard” measure of price inflation. (See the Autumn 2000 article for a detailed description of the core rate of inflation.)

The next three columns in Table 1 report the rates of return on Government of Canada 5-year and 10-year bonds and on 5-year Guaranteed Investment Certificates (GICs). The former represent the minimum rates of return that investors can expect on safe investments. The rate of return on GICs, on the other hand, represents the interest rate available on a mixed, low-risk portfolio of stocks and bonds.

Table 1

Table 2 reports seven measures of the real rate of interest – that is, the rate of interest net of the expected rate of inflation. The first of these is the market-determined rate of return on “real rate of return bonds” – bonds whose value is denominated in terms of the real rate of interest. These bonds are of particular importance because they are purchased by sophisticated investors and because they tend to held for long periods of time.

The second, fourth, and sixth columns report the 5- and 10-year government bond interest rates and 5-year GIC rates net of the core inflation measure.

Finally, columns three, five, and seven report the government bond and GIC rates net of the Bank of Canada’s target rate of inflation of 2 percent. As the Bank has managed to keep the core rate of inflation within a small band around this target for the last eight years, it is widely believed that 2 percent is the rate that is expected by most investors. That is, investors are believed to act as if the real rate of interest is the observed, nominal rate less 2 percent.

Table 2

Interpretation of the data

The data in Table 2 indicate that real rates of interest have continued the downward trend that began in 1996/1997. Whereas we concluded a year ago that long-term interest rates were approximately 3½ percent and short-term rates approximately 2½ percent; it appears that those rates have now fallen to 3 percent and 2¼ percent, respectively.

Note that the latter rate is close to the rates reported in the Bank of Canada’s Monetary Policy Report of April 2003 (Chart 19, p. 24).

In addition, 3 percent is the rate at which the Bank of Canada recently issued a new set of 33-year real rate of interest bonds. As we argued in the Autumn 2000 issue of the Expert Witness, the rate of return on these bonds is a particularly reliable estimate of the expected real interest rate as they are purchased primarily by large institutional investors (like pension funds) that have made considerable investments in the prediction of future rates of interest and inflation.

For this reason, we believe that it would be appropriate to revise our existing 2½ and 3½ percent two-part forecast of real interest rates. Based primarily on the observed rate on 5-year Government of Canada bonds, we propose to use a rate of 2¼ percent for the first five years of all calculations. For all subsequent years we propose to use a rate of 3¼ percent – though we note that a rate as low as 3 percent could be supported based on the most recent observed rates on 10-year Government of Canada bonds and based on the Bank of Canada’s current issue of real rate of return bonds. Our long-term rate is perhaps slightly conservative, but we will re-examine this issue next year and decide then if changes are warranted.

leaf

Christopher Bruce is the President of Economica and a Professor of Economics at the University of Calgary. He is also the author of Assessment of Personal Injury Damages (Butterworths, 2004).

Derek Aldridge is a consultant with Economica and has a Master of Arts degree (in economics) from the University of Victoria.

Scott Beesley is a consultant with Economica and has a Master of Arts degree (in economics) from the University of British Columbia.

Kelly Rathje is a consultant with Economica and has a Master of Arts degree (in economics) from the University of Calgary.