Fatal Accident Dependency Calculations

by Derek Aldridge

This article was originally published in the winter 1999 issue of the Expert Witness.

We occasionally review cases in which the defendant is arguing that, after a fatal accident, the surviving spouse is financially better off. This sort of argument can be somewhat appealing in certain circumstances, but upon closer examination the “logic” is always unsupportable. Of course, I am referring to the distinction between sole- and cross-dependency. In this article I will briefly explain what dependency rates represent, and then offer a fairly detailed explanation of the differences between the sole-dependency approach and the cross-dependency approach.

Dependency rates are used to estimate a person’s financial loss due to the death of his or her spouse or parent. In a two-person household, if the husband dies, then the wife will no longer benefit from her husband’s income. However, she does not need to be compensated for the loss of all of his income, since some would have benefited him only.

To properly compensate the surviving dependant, it is necessary to determine how much of the deceased’s income the survivor needs in order to maintain the same standard of living as if the accident had not occurred. To make this determination, one must estimate how much of the deceased’s income would be allocated to common expenditures (mortgage payments, for example), and how much would be allocated to each spouse’s personal expenditures (food, clothing, and hobbies, for example). Our research suggests that, in general, about 40 percent of after-tax family income is allocated to common expenditures, and 30 percent to each spouse’s personal expenditures. We make the reasonable assumption that each spouse allocates his/her income in this manner. Thus, the surviving spouse requires approximately 70 percent of the deceased’s “without-accident” income, in order to maintain the without-accident standard of living. That is, the survivor still needs the 40 percent of the deceased’s income that would have been spent on common expenditures, as well as 30 percent that would have been spent on the survivor’s personal expenditures, but does not need the 30 percent of the deceased’s income that benefited the deceased only. The 70 percent is the dependency rate. Thus, I would argue that if the deceased would have earned $30,000 per year (after taxes and contingencies), had the accident not occurred, then the survivor now needs 70 percent of this income, or $21,000 per year in order to maintain the without-accident standard of living.

This approach – known as the sole dependency approach – is very appealing in many cases, thanks to its simplicity and the intuitively reasonable results that it generates. However, it is often argued that it needs to be modified in order not to over-compensate the survivor. The issue is how to treat the survivor’s income that would have benefited the deceased only. One might argue that the survivor’s lost share of the deceased’s income should be offset against her financial “gain” because she no longer spends money on items which benefited her husband exclusively. This is known as the cross-dependency approach.

I will attempt to more clearly explain the distinction between sole- and cross-dependency through a series of tables in which we consider a range of possible incomes earned by a hypothetical couple. (For the purposes of this article, I ignore the effect of dependent children.)

Table 1 illustrates how a couple’s income is allocated among the three broad expenditure categories, for a range of different income levels. (The reason why several different income levels are presented will become apparent later.)
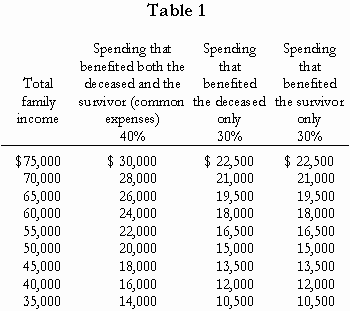
Table 1

We can take the examples shown in Table 1 a step further by examining the more general case in which we consider the income earned by both members of the household. This is shown in Table 2. Note that the “total family income” figures in Table 2 are exactly the same as those in Table 1. As are the spending allocation figures.

Table 2

We can take this example another step further by considering how each member of the household allocates his/her income. Presumably, both spouses follow the 40/30/30 percent pattern when spending their income. Thus, each allocates about 40 percent of his/her income to common expenditures, 30 percent to his/her own personal expenditures, and 30 percent to the spouse’s personal expenditures. In Table 3 I follow the examples from Table 2, except that I show the allocation of spending by each spouse. Note that the “total family income” figures in Table 3 are exactly the same as in Tables 1 and 2, as are the totals of the individual spending allocation figures.
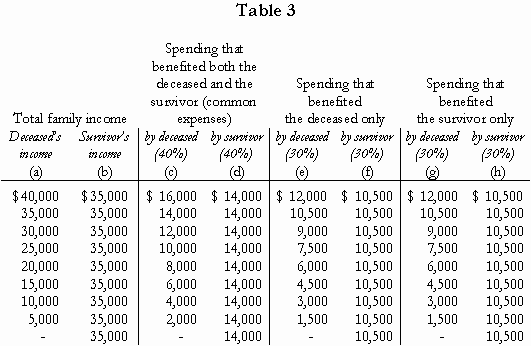
Table 3

Using the figures shown in Table 3, I can estimate the survivor’s financial loss upon the death of his or her spouse. It is clear that for the survivor to maintain the same standard of living as if the accident had not occurred, he or she will need enough income to fund the common expenditures shown (columns c & d), as well as the expenditures that were for his/her own personal benefit (columns g & h). Thus, what the survivor has lost, due to the death of his or her spouse is the sum of columns c and g. (The survivor has not lost columns d and h because he or she is still earning the income to pay for those expenses.) This is the sole-dependency approach.

The cross-dependency approach asks the question, “What should happen with the share of the survivor’s income that the survivor would have spent on the deceased (column f)?” The cross-dependency approach finds that this income has been saved, and should be offset against the sum of columns c and g. It finds that the survivor’s loss equals c + g – f. (Instead of just c + g, which is the finding of the sole-dependency approach.)*

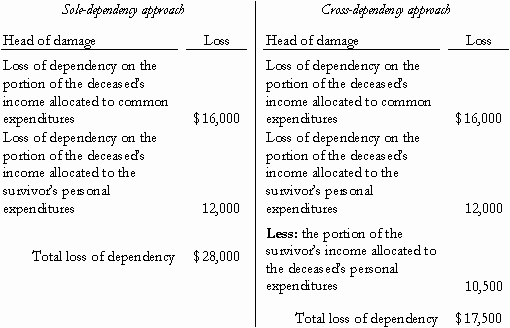
Note that the dependency losses using either sole- or cross-dependency are always reported as the total of c + g – f (for cross-dependency) or the total of c + g (for sole-dependency). This is conventional, but it would be equally reasonable to report the individual components under separate heads of damage. For example, considering the top row of Table 3, the results could be reported as follows:
Results Table

With the total cross-dependency loss separated into its individual components (above), it is clearer why I disagree with that approach. First, I do not believe that it is economically correct to deduct the portion of the survivor’s income that would have been allocated to the deceased’s personal expenditures ($10,500) from the other components of the loss. Second, I do not believe that this deduction is consistent with other forms of personal injury damage assessment.

From an economic standpoint, I do not agree that the survivor’s income that would have been allocated to the deceased’s personal expenditures ($10,500 in the above example) should be deducted from the other components of the loss. I think most would agree that individuals spend part of their income on their spouses because they want to – in economic terms, they receive an offsetting benefit. Following the death of a spouse, the best that a survivor can do is spend this money on alternative goods. But, since the survivor had previously chosen to spend this money on his or her spouse rather than these alternative goods, these goods must represent a “second-best” choice. For example if a surviving wife had previously been spending $3,000 on goods which benefited her (now deceased) husband alone, and she now spends that money on alternative goods then, at best, that expenditure leaves her no better off than before. She has simply transferred the $3,000 from one set of expenditures to another. Hence, the $3,000 should not be offset against her loss of dependency.

It is my view that the correct way to compensate the survivor in this case is for the defendant to provide her with the income contribution that her husband would have made, had the accident not occurred (that is, the contributions to common expenses and to expenses which benefited the survivor only). The portion of the wife’s own income that would have been spent on her husband should remain available to be spent elsewhere at its second-best use (on holidays, gifts, charitable contributions, or whatever). From an economic standpoint, this will not leave the survivor financially better off. To argue in favour of cross-dependency, one must surely explain why the survivor is expected to use a portion of her own employment income to offset the defendant’s obligation.

I also do not believe that the deduction component of the cross-dependency approach is consistent with other forms of personal injury damage assessment. Cross-dependency requires that a plaintiff’s losses due to an accident should be reduced by any “savings” due to the accident (see the discussion above). Similar “savings” are seen in other forms of personal injury damage assessment, but are not deducted from losses. For example, plaintiffs who will be forced to retire early (or are unemployable) due to their injuries will “gain” a great deal of leisure time during the years when they otherwise would have worked. The value of this gain in leisure is not deducted from their losses. A father who was injured in a car accident that killed his son will now “save” the money he would have spent on his son. That savings is not deducted from the father’s loss of income award. Quadriplegics will “save” money on shoes, golf memberships, ski passes, and so forth. That savings is not deducted from their other losses.

Another difficulty with the cross-dependency approach is that if one follows the methodology consistently, it leads to indefensible results in many cases. Following the examples shown in the tables above, we see – below – that if the deceased’s income was much less than the survivor’s then cross-dependency will show that the survivor’s loss is negative (a net gain).
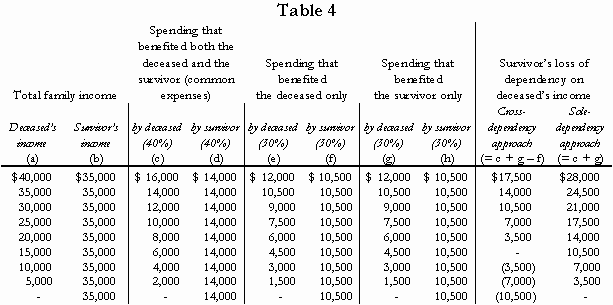
Table 4

As shown by the examples in Table 4 (above), the sole dependency approach yields results that are, intuitively, much more reasonable, given a wide range of income assumptions. The sole-dependency approach will never find that a survivor is financially “better off” following the death of his or her spouse. As shown, the cross-dependency approach will yield such a result in cases in which the deceased earned much less than the survivor.

The “negative loss” results generated by the cross-dependency approach are often ignored, and it is stated that the survivor has suffered “no net financial loss”. Of course the true result implied by the cross-dependency approach is that the survivor has experienced a net financial gain. Cross-dependency is always ignored when the deceased did not earn any income (and the survivor was the sole income earner), since the method – if followed – will always show that the survivor is financially better off. If the cross-dependency approach was accepted, it would seem that in such a case the survivor’s gain in net income should be offset against his or her loss of dependency on household services. Of course it is not. In my view, part of the reason why the cross-dependency approach has enjoyed some level of acceptance is because its supporters only use it when it yields results that seem intuitively reasonable. When cross-dependency leads to the nonsensical results described here, it is usually (if not always) abandoned.

Footnotes

* Note that the above description of cross-dependency is sometimes stated differently, although mathematically it is the same. The other way to describe cross-dependency is that it is 70 percent of the couple’s combined pre-accident income, less the survivor’s income. That is, 0.7[a + b] – b, using the above table. This is the same as 0.7a + 0.7b – b. Note also that 0.7a = c + g; 0.7b = d + h; and b = d + f + h. Thus the cross-dependency loss equals c + g + d + h – [d + f + h]. This reduces to c + g – f, which is exactly the same as I noted above. [back to text of article]

leaf

Derek Aldridge is a consultant with Economica and has a Master of Arts degree (in economics) from the University of Victoria.

Recent Canadian Court Decisions Concerning the Impacts of Child Sexual Abuse on Earnings

by Christopher Bruce and Matthew Foss

This article was originally published in the winter 1999 issue of the Expert Witness.

We reviewed approximately 35 Canadian tort cases involving sexual assault that had been decided in the last decade. In this section, we review the findings of those cases under three damage headings: loss of earnings, loss of opportunity to marry, and punitive damages.

No loss of earnings

In approximately one quarter of the cases we reviewed, the courts denied the plaintiff’s claim for loss of earnings (after sexual assault had been proven). In some, – for example, B(KL) v. B(KE), M(LN) v. Green, and H(JL) v. H(DH) – the courts concluded that the non-pecuniary damages were “adequate” and, hence, pecuniary damages were not necessary. In others, for example C(P) v. C(RJ) and A(T) v. K(R), it was concluded that the plaintiff had not offered sufficient evidence on which to base an award. Finally, in both Gray v. Reeves and S(T) v. P(JW), the court could find no difference between the income the plaintiff would have expected to earn had he or she not been assaulted and the income he/she was actually earning.

These cases strike us as being consistent with the academic literature, which found that many victims of sexual abuse had not suffered long-term effects, particularly on earnings. Hence, it is not unexpected that some plaintiffs would be denied damages on this ground, particularly if they had not provided strong evidence of long-term (significant) harm.

Loss of earnings

In approximately three quarters of the cases which proceeded to trial, the plaintiff was able to obtain damages for loss of earnings. This is a higher percentage than the literature would lead one to expect. However, it must be remembered that the cases that reach trial are not a random sample of all possible cases. Presumably, few individuals who suffered no loss of income would press a case to that point.

The most common basis for the calculation of loss of income was that the plaintiff had suffered a reduction in the level of educational attainment, or had suffered a delay in reaching his or her ultimate educational level. In A(C) v C(JW), for example, it was found that one of the plaintiffs would have become an automobile mechanic and would only do so now, if at all, after a significant delay. In C(PA) v. T(JC), it was found that the effect of the abuse had been to prevent the plaintiff from graduating from high school. In P(J) v. Sinclair, the plaintiff’s actual earnings were compared to those she would have made had she completed two years of post-secondary education. And in P(S) v. K(F), the court concluded that it was reasonable to assume that the plaintiff would have completed high school but would not now do so.

Alternatively, in many cases, the courts accepted the argument that the plaintiff had achieved the same level of education as she or he would have in the absence of the abuse, but that the plaintiff would now suffer from higher unemployment, increased part-time work, or reduced overtime work. In B(J) v. M(F), the abuse was so severe that the court concluded the plaintiff would now be unable to work at all. In C(H) v. C(GC), the court accepted the argument that the effect of the abuse would force the plaintiff to reduce working hours from full-time to part-time. And in J(A) v. D(W), the court found that the plaintiff had missed a considerable amount of time from work during the pre-trial period.

In many of the cases in which damages for loss of income were awarded, the court implicitly recognised the argument that the victim’s low income might be due not only to the sexual abuse, but also to a dysfunctional family background. In A(C) v. C(JW), for example, there were four plaintiffs. The court noted that four out of five of plaintiff LK’s siblings had criminal records, were drug abusers, or otherwise had exhibited “lack of vocational success.” It appears that the court reduced LK’s damages on this basis. In the same case, on the other hand, the court noted that all three of plaintiff CH’s brothers had been successful and it awarded substantially more to CH than it had to LK. Similarly, in K(W) v. Pornbacher, because the plaintiff had a pre-existing prognosis of attention deficit disorder, the court reduced the damages it would otherwise have awarded. And in T(KA) v. B(JH), the court reduced the past loss to take account of “other contingencies” that might have affected the plaintiff’s earning capacity.

A common thread running through many of the cases in which victims were awarded damages for loss of income was the expectation by the court that the victim would soon “recover” from the effects of the abuse. The incomes of individuals who had suffered abuse 10 or 20 years prior to the trial were expected to “catch up,” within a few years of the court’s decision, to the incomes of those who had never been abused. In D(PA) v. H(AE), for example, the court awarded damages for only two years future loss. In V(JL) v. H(P), the court accepted the contention that the plaintiff would fully catch up within 5 years. And in P(J) v. Sinclair, the court assumed that the loss would continue for only 10 years into the future.

Loss of opportunity to marry

In two cases, the plaintiff argued that the effects of the sexual abuse had impaired her ability to marry. In Gray v. Reeves, the court concluded that the plaintiff had failed to provide adequate evidence concerning this claim, and refused to award damages. In LMN v. M(MJ), however, the court accepted the claim. Unfortunately, the court awarded a single sum to cover both loss of income and loss of marital prospect. Hence, it is not possible to determine what the value of the award was for loss of marital prospect.

Punitive damages

We were able to identify six cases in which punitive damages were discussed. In three, M(TD) v. G(KS), N(JL) v. G(KS), and Glendale v. Drozdzik, the court refused to award punitive damages. In the latter, the British Columbia Court of Appeal quoted approvingly from Huff v. Price, to the effect that:

The award of punitive damages should not try to do again what has already been done by the compensatory damages, including the aggravated damages. … And, of course, if a criminal penalty has been imposed then that should be taken into consideration. (p. 300)

Nevertheless, the court in Glendale added that:

…the rule would be too absolute if it were that punitive damages cannot be awarded if there has been a criminal penalty. Sometimes the criminal penalty might be as little as a conditional discharge…

In none of the three cases in which punitive damages were awarded were the defendants jailed for their assaults on the plaintiffs. In B(JD) v. M(F), the defendant was charged criminally for offences against other children, but not for those against B(JD). In C(H) v. C(GC), no criminal charges were laid against either of two defendants. And in M(M) v. F(R), the defendant received only three years probation on the criminal charge. All three, therefore, appear to be consistent with the view that punitive damages should, generally, only be awarded when there have been no criminal penalties, or those penalties have not been severe.

Summary

To summarise, the courts have looked for evidence that the plaintiff’s past and future earnings were impeded by the sexual abuse. This involved examining factors such as the plaintiff’s likely education without the sexual abuse, work history, and foreseeable career path in the future. Other factors that were given weight in the decisions included the accomplishments of siblings and the environment that the plaintiff grew up in (excluding the sexual abuse). The courts have not, in general, been overly generous to plaintiffs in their awards for lost earnings.

References

A (C.) v. C. (J.W.), 1997, 36 C.C.L.T. (2d) 224, 35 B.C.L.R. (3d) 234 (BCSC)

A.(D.A.) v. B. (D.K.), 1995, 27 C.C.L.T. (2d) 256 (Ontario Court of Justice (General Division))

A (T.) v. K. (R.), 1995, 15 B.C.L.R. (3d) 274, [1996] 3 W.W.R. 720 (BCSC)

B. (J.D.) v. M. (F.) 1998, Docket: Bracebridge 233/96, (Ontario Court of Justice (General Division))

B. (K.L.) v. B. (K.E.), 1991, 7 C.C.L.T. (2d) 105, 71 Man. R. (2d) 265 (Man. Q.B.)

C. (H.) v. C. (G.C.) 1998, Docket: 101497/96, 101496/96, (Ontario Court of Justice (General Division))

C. (P.) v. C. (R.J.), 1994, 114 D.L.R. (4th) 151, (Ontario Court of Justice (General Division))

C. (P.A.) v. T. (J.C.), 1998, Docket: Courtenay S3229, (BCSC)

D. (P.A.) v. H. (A.E.), 1998, 49 B.C.L.R. (3d) 340, [1999] 2 W.W.R. 139, (BCSC)

Glendale v. Drozdzik, 1993, 77 B.C.L.R. (2d) 106, 101 D.L.R. (4th) 101, (B.C.C.A.)

Gray v. Reeves, 1992, 64 B.C.L.R. (2d) 275, 10 C.C.L.T. (2d) 32, [1992] 3 W.W.R. 393, 89 D.L.R. (4th) 315, (BCSC)

H. (J.L.) v. H. (D.H.), 1999, Docket: F/C/259/96 (NBQB)

H. (S.) v. L. (R.G.), 1993, 85 B.C.L.R. (2d) 232, [1994] 2 W.W.R. 276 (BCSC)

Huff v. Price, 1990, 51 B.C.L.R. (2d) 282 (B.C.C.A.)

J. (A.) v. D. (W.) 1999, 136 Man. R. (2d) 84 (Man. QB)

K. (W.) v. Pornbacher, 1997, 32 B.C.L.R. (3d) 360, 27 C.C.E.L. (2d) 315, 34 C.C.L.T. (2d) 174, [1998] 3 W.W.R. 149 (BCSC)

LMN v. M. (M.J.), 1998, Docket: New Westminster SO-41750 (BCSC)

M. (L N) v. Green Estate, 1996, Docket: Doc. Vancouver C932295, (BCSC)

M. (M.) v. F. (R.), 1996, 22 B.C.L.R. (3d) 18, [1996] 8 W.W.R. 704, (BCSC)

M. (T.D.) v. G. (K.S.) 1997, Docket: Vancouver C961248, (BCSC)

N. (J.L.) v. L. (A.M.),.[1989] 1 W.W.R. 438, 47 C.C.L.T. 65, 56 Man. R. (2d) 161 (Man. Q.B.)

P. (J.) v. Sinclair, 1999, Docket: Victoria 93/3581, (BCSC)

P. (S.) v. K. (F.), [1997] 3 W.W.R. 161, 1996, 150 Sask. R. 173, 32 C.C.L.T. (2d) 250, (Sask. QB)

P. v. F., 1996, 24 B.C.L.R. (3d) 105 (BCSC)

S. (J.E.) v. M. (P.D.) Estate, 1998, Docket: Victoria 97 2335, (BCSC)

S. (L.) v. R. (L.), 1996, Docket: Vancouver C942578 (BCSC)

S. (P.) v. S. (J.), 1996, Docket: Milton C12210/93, (Ontario Supreme Court General Division)

S. (T.) v. P. (J.W.), 1999, Docket: Victoria 98/1477, (BCSC)

T. (K.A.) v. B. (J.H.), 1998, 51 B.C.L.R. (3d) 259, (BCSC)

T. (L.) v. T. (R.W.), 1997, 36 C.C.L.T. (2d) 207, 36 B.C.L.R. (3d) 165, (BCSC)

V. (J.L.) v. H. (P.), 1997, 31 B.C.L.R. (3d) 155 (BCSC)

leaf

Christopher Bruce is the President of Economica and a Professor of Economics at the University of Calgary. He is also the author of Assessment of Personal Injury Damages (Butterworths, 2004).

Matthew Foss is an M.A. student in the Department of Economics, University of Calgary. This is a continuation of his article “The Calculation of Damages in Sexual Abuse Cases” which appeared in the previous issue of this newsletter.

Rates of Return to Advanced Education in Alberta

by Kelly Rathje

This article was originally published in the winter 1999 issue of the Expert Witness.

Conventional wisdom appears to suggest that, if young Canadians wish to be competitive in today’s economy, they should concentrate on the relatively technical disciplines, such as engineering and business. I have tested this “wisdom” using information about post-secondary education in Alberta.

In my study, I assume that post-secondary education represents an investment that the individual makes in him- or herself. As with any investment, the investor expects to receive a return on that investment. By calculating the implicit “rates of return” on investment in various types and levels of post-secondary education, and then comparing those rates with the interest rate one could expect to receive on a secure financial investment, I hope to answer the question: “does higher education pay off”?

To understand what is meant by a rate of return on “investment” in education, consider the following simple example. Assume that, at age 20, you were told that if you spent $10,000 on a particular investment, you would be paid $500 per year for the rest of your life. It is easy to see that that investment was equivalent to spending $10,000 on a bond that paid 5% interest (for the rest of your life). Similarly, imagine that if you were to spend $10,000 on education at age 20, that education would result in an increase in your income of $500 per year (for the rest of your life). The purchase of that education could be thought of as yielding an annual rate of return of 5%.

I calculate the rates of return on various types of educational investments and compare those rates of return to the interest rates that one can obtain on secure financial instruments. For the latter purpose, I use a real interest rate of 4.25 percent, (the usual discount rate in personal injury assessments). If the rate of return on a particular level of education is greater than 4.25 percent, then I consider that level of education to be a worthwhile investment for the individual.

When thinking of education as an investment, it is first necessary to identify the “costs” of that investment and the benefits. The cost component of my analysis is composed of tuition fees, the costs of books and supplies, and, most importantly, the income that is “given-up” by choosing to attend school rather than enter the labour force. The benefit component is measured by the increase in income from having one level of education rather than another. For example, the benefit of having a bachelor’s degree over a high school diploma would be measured by the difference in the earnings stream, after the completion of the bachelor’s degree, over the earnings stream of a high school diploma holder.

Before the rates of return were calculated, I examined average incomes by level of education. From my results, the average incomes for males are greater at all levels of education (high school to Ph.D. degrees) than for females. High school resulted in the lowest income, followed by trade school, then college. For the different university degrees available, average income increases with education. The Ph.D. graduates earned the highest incomes, for both males and females.

These results were not a surprise, there have been many studies and articles written about the relationship between education and income. Post-secondary education results in increased average incomes, and the higher the level of education, the higher the average income. Also, the male incomes are higher than the female incomes, another result that is not surprising.

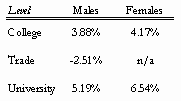
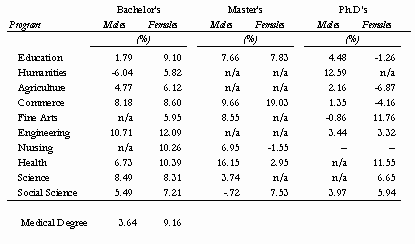
Turning to the rates of return, I found that overall, the highest return on investment (that is the highest benefits relative to the costs) results from university education. (See Table 1.) Among university graduates, bachelor’s degrees resulted in the highest rate of return. (See Table 2.)

Table 1: Private Rates of Return from Post-secondary Education: Alberta

Table 1

Table 2: Private Rates of Return from University Education: Alberta

Table 2

Overall, the graduate degrees do not offer rates of return on investment that are as high as the rates earned on undergraduate degrees, either for males or females. Many programs at the graduate degree level did not meet my 4.25 percent benchmark, implying that the cost of obtaining this level of education is not justified by the return on investment.

The highest returns for males result from the science and technical programs such as commerce, engineering, and science. (See Table 2.) Females, by comparison, receive the highest returns from the commerce, nursing and health programs – again the more technical programs. The same result occurred at the master’s level, where the science and technical programs offered the highest returns for males. For females, commerce offered the highest return. The next highest resulted from the education and social sciences programs – liberal arts programs, rather than the more technical programs. At the Ph.D. level, the humanities program for males and the fine arts program for females result in the highest return on investment. Thus, at the Ph.D. level, the highest returns result from the liberal arts programs, not the science and technical programs that fared well at the undergraduate and master’s levels.

Females generally receive a higher return on investment than males, even though the resulting incomes are lower than for males. The lower average incomes for females means that the amount of income “given up” while attending post-secondary institutes is less for females than for males, making the costs for females lower. Since costs are lower, it does not take as long to recoup the investment.

A surprising result is that the return to college and trade education falls just short of my 4.25 percent benchmark. This implies that an individual considering investing in this level of post-secondary education would receive a higher return on their money by allocating the funds to an alternative investment, or attending university. Although the average incomes do increase with any type of post-secondary education, from an investment perspective, the returns resulting from trade and college education are not as high as from a university education.

My results indicate that individuals planning to “invest” in post-secondary education would receive the highest return from an undergraduate degree, especially the science and technical programs. The increase in income will more than cover the cost of attaining the degree, meaning the investment will “pay-off”. Diploma and certificate programs offered by trades and colleges do increase average incomes, but it is questionable whether or not these “pay off” from an investment perspective based on my assumptions. The average income these graduates receive is higher than income received by high school graduates, but the increase may not cover the entire cost of acquiring the education.

leaf

Kelly Rathje is a consultant with Economica and has a Master of Arts degree (in economics) from the University of Calgary.