The Impact of Poor Health on Retirement Age

by Christopher Bruce

This article first appeared in the autumn 2007 issue of the Expert Witness.

In personal injury cases, plaintiffs often argue that their disabilities will induce them to retire early and, therefore, cause a reduction in lifetime earnings. As such claims are largely based on the plaintiff’s own testimony, it is often difficult for the courts to determine whether the claim is credible and, if so, to identify the number of years by which retirement will be accelerated.

The purpose of this article is to assist the court in these determinations by providing a survey of the academic literature on the effects that health limitations have on the age of retirement. As the first edition of my textbook, Assessment of Personal Injury Damages (Butterworths, 1985) contains a survey of the early literature on this topic, I concentrate in this paper on articles published since 1990.

This yields a set of eight studies. Of these, two (Disney, for Britain, and Campolieti, for Canada) reported only that a negative change in health or disability status among individuals over 50 had a “significant” negative effect on the age at which those individuals retired.

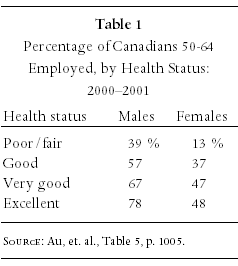
Of the remaining studies, two provided data concerning the impact of alternative levels of health status on the probability that 50-65 year-olds would be working. Au, Crossley, and Schellhorn, using Canadian data from 2000-2001, reported that even a minor change in health status, from “very good” to “good,” would reduce the probability of employment by 10 percent. (See Table 1.) And a change from “excellent” to “poor/fair” could reduce employment by as much as 40 percent (among males).

Table 1

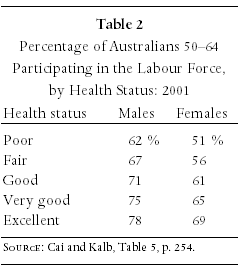
Similarly, Cai and Kalb, using Australian data from 2001, found that a change in health status from “excellent” to “poor” would reduce the probability that individuals would be in the labour force by approximately 16-18 percent. (See Table 2.)

Table 2

At age 55, these reductions in probabilities imply that individuals in poor health will retire between one and two years earlier than those in very good health. This is consistent with Gustman and Steinmeier’s finding, for the United States, that individuals who were “limited in the kind or amount of work” in which they could engage could be expected to retire two years earlier than those not so-limited.

Berger and Pelkowski, for the United States, and Jimenez-Martin, Labeaga, and Prieto, for Spain, also found impacts that were similar to those found by Campolieti and Au, et. al., but using somewhat different measures of health status.

Jimenez-Martin et. al. reported that 55-65 year-old individuals with “severe disability” were 14.6 percent less likely to be employed than were the non-disabled, and that those with “very severe disability” were 28.5 percent less likely to be employed than were the non-disabled.

Berger and Pelkowski found that among 51-61 year-old couples in which both the husband and wife had (at the beginning of the study period) been healthy and employed, the effect of a health problem was to reduce the probability that the wife would be working by 19 percent and that the husband would be working by 35 percent.

Finally, McGarry found that a change in health status from “good” to “fair” would reduce the probability that a 62 year-old would be working from approximately 45 percent to 40 percent.

To summarise, regardless of the country that is investigated, the evidence is clear: a reduction in health, from “good” to “fair or poor” will have a significant, negative impact on the probability that 50-65 year-old individuals will be working. Although the precise effect of such a reduction varies from study to study, there appears to be fairly consistent evidence that the average effect is to reduce the age of retirement by approximately two years (for example, from age 61 to age 59).

References

Au, D. W., T. Crossley, and M. Schellhorn (2005) “The effect of long-term health on the work activity of older Canadians.” 14 Health Economics, 999-1018.

Berger, M., and J. Pelkowski (2004) “Health and family labor force transitions.” 43 Quarterly Journal of Business and Economics, 113-138.

Cai, L., and G. Kalb (2006) “Health status and labour force participation: Evidence from Australia.” 15 Health Economics, 241-261.

Campolieti, M. (2002) “Disability and the labor force participation of older men in Canada.” 9 Labor Economics, 405-432.

Disney, R., C. Emmerson, and M. Wakefield (2006) “Ill health and retirement in Britain: A panel data-based analysis.” 25 Journal of Health Economics, 621-649.

Gustman, A., and T. Steinmeier (2000) “Retirement in dual-career families: A structural model.” 18 Journal of Labor Economics, 503-545.

Jimenez-Martin, S., J. Labeaga, and C. Prieto (2006) “A sequential model of older workers’ labor force transitions after a health shock.” 15 Health Economics, 1033-1054.

McGarry, K. (2004) “Health and retirement: Do changes in health affect retirement expectations?” 39 Journal of Human Resources, 624-648.

leaf

Christopher Bruce is the President of Economica and a Professor of Economics at the University of Calgary. He is also the author of Assessment of Personal Injury Damages (Butterworths, 2004).

Using the HALS/PALS data sets to estimate a loss of income

by Derek Aldridge

This article first appeared in the spring 2007 issue of the Expert Witness.

Many of our readers will have heard of Statistics Canada’s “HALS” and “PALS” disability statistics. These result from surveys that collected data concerning Canadians with disabilities and the manner in which their everyday lives are affected by these disabilities. The HALS statistics are from Statistics Canada’s 1991 Health and Activity Limitation Survey and the PALS statistics are from the 2001 Participation and Activity Limitation Survey.

Of particular interest to our readers is how these statistics can be used to predict the economic impact that a particular disability will have on a specific plaintiff. I have been asked numerous times by plaintiff’s lawyers if it is possible to use the HALS statistics to help determine their client’s loss. In addition, I have been asked by defence lawyers to rebut the claims of other economists who have used this approach. In this article I will discuss the difficulty of using the HALS/PALS approach to estimate a plaintiff’s loss of income. Before offering my comments concerning these statistics, I will provide some background information on the data sets.

In the 1991 and 2001 censuses, recipients of the long-form census forms were asked a few questions designed to determine whether or not they were disabled in a way that limited their activities at home, at work, or at school. Some of those who indicated a disability were subsequently interviewed for a detailed disability survey (a “post-censal” survey). Following the 1991 census, approximately 35,000 adults from the “disabled” census group were selected for the detailed HALS survey. (For technical reasons that do not need to be discussed here, a larger number from the “non-disabled” census group were also selected for the follow-up survey.) Following the 2001 census, approximately 35,000 adults and 8,000 children from the “disabled” census group were selected for the detailed PALS survey.

The 1991 HALS survey identified six types of activity limitation among the adults surveyed: hearing, seeing, speech, mobility, agility, and other (a grouping of non-physical disabilities related to psychological conditions, learning, memory, and so forth). The 2001 PALS survey identified ten types of limitation: hearing, seeing, speech, mobility, agility, learning, developmental disability or disorder, psychological, memory limitation, and chronic pain. Individuals were asked questions to determine the degree of their disability and based on the answers to these questions, their level of disability was assigned a severity scale. In 1991 there were three severity levels: mild, moderate, and severe. In 2001 the severity levels (except for children under five) were mild, moderate, severe, and very severe. The classification examples below are from the Statistics Canada Publication A Profile of Disability in Canada, 2001 (Catalogue 89-577-XIE):

For example, a person who has no difficulty walking and
climbing stairs but cannot stand in line for more than 20
minutes, would have a mild mobility-related disability. A
person who can only move around in a wheelchair would have
their mobility more severely limited, and one who is
bedridden for a long term period would have a very severe
mobility-related disability. The number of disabilities also
has an impact on the overall level of severity. The PALS
distinguishes 10 types of disabilities among adults and the
level of severity will increase with the number of
disabilities affecting each individual. [Pages
19-20]

In addition to questioning individuals about their limitations, PALS also asked about the cause of disability (e.g., a motor vehicle accident), the age at which the activity limitations began, the level of education, the number of hours worked per week, the reason for working fewer than 30 hours per week, the person’s occupation and industry, the rate of pay, the amount of unemployment experienced in the past year, and numerous other questions. The PALS questionnaire and reporting guide is 86 pages long.

As a result of these surveys, there is a wealth of information available concerning people with disabilities in Canada. Some examples follow, again taken from the publication A Profile of Disability in Canada, 2001:

  • Mobility problems are the type of disability most often
    reported by adults aged 15 and over. In 2001, nearly 2.5
    million or 10.5 percent of Canadians had difficulty walking,
    climbing stairs, carrying an object for a short distance,
    standing in line for 20 minutes or moving about from one room
    to another.
  • More than 10 percent of adults have activity limitations
    related to pain or discomfort.
  • The prevalence of most types of disabilities increases
    with age.
  • A large majority of persons with disabilities aged 15 and
    over have more than one disability.
  • Nearly 6 percent of Canadians aged 15 and over have a
    severe or very severe disability.
  • 7.5 percent of all working-age persons are limited in
    their activities due to pain or discomfort.

This is all very interesting, and surely the survey results have many useful applications. However, for our purposes, we want to know how these surveys can be used to help estimate a specific person’s loss of income as a result of an injury. A statistical (econometric) analysis of the data could tell us (for example) how the annual income of an average “severely disabled” male differs from that of males overall. Even better, we might be able to compare the incomes of male journeyman welders age 30-40 who are experiencing severe pain and agility disabilities, with the corresponding average for those who are not disabled. (Or with the corresponding overall average that includes mostly people who are not disabled, and some who are.) Note however, that we have a problem in that as we get more and more specific with respect the category of disabled people, we have less and less confidence in the accuracy of the reported averages. This is because as we get more specific, our sample size gets smaller and smaller and the characteristics of the sample become heavily influenced by the characteristics of a few individuals. I think we could be reasonably confident in our claims about the earnings of severely disabled males relative to males overall, but not very confident at all about my hypothetical welders.

For now let us ignore the technical problems that might arise, and suppose that we are able to construct a statistical model with the HALS data and use it to estimate with confidence, the average earnings of full-time employed severely disabled males aged 30-40 with high school diplomas. Suppose we find that they earn 25 percent less than the overall average for full-time employed males aged 30-40 with high school diplomas. How can we use this information when we come upon a 35-year-old plaintiff who is a high school graduate and has residual deficits that can be categorised as severe? Suppose the plaintiff is working as a full-time truck driver, and we determine that he is earning about 25 percent less than the average for truck drivers his age (consistent with the HALS prediction). Perhaps we can now conclude that the HALS approach does a fine job of predicting his loss of income, assume that the 25 percent loss will continue until retirement, calculate the present value, and move on to the next case.

This conclusion might be reasonable, but what if it is found that the plaintiff can improve his income by retraining and changing occupations? What if it is found that his condition will improve (or worsen) in the future? What if we find that he was already earning a below-average income before he was injured? My point here is that while it is useful to consider the average impact of disability, it is more important to examine the specific plaintiff at hand and investigate how his injuries are affecting his employability and his income. With respect to these issues, the advice of a vocational expert can often be especially helpful.

It is important to recognise the meaning of my (hypothetical) 25 percent reduction estimate, and its limitations. I proposed that the evidence might support a conclusion that full-time employed severely disabled 30-40 year-old males with high school diplomas earn 25 percent less than their non-disabled counterparts on average. In other words, if we randomly selected from the population a person in this category, we would predict that his income will be 25 percent less than the average for his non-disabled counterparts. However, once we can more closely examine the randomly chosen person, we learn more information about him and we may need to revise our prediction.

For example, suppose he has a severe mobility disability but he is also a professional writer. In this case we might have to revise our prediction since his earnings as a writer are probably only slightly affected by his poor mobility. What if we learned that he had been a professional hockey player but had to leave that occupation and is now working in sales? In this case we would also revise our prediction since his earnings reduction is likely much more than 25 percent. It should be clear that as soon as we are considering a particular individual, and not some unknown “randomly selected” person, we need to try to incorporate the additional information we have about that person, and if our HALS estimates are no longer sensible, they should be discarded. This principle is the same as would apply if we wanted to predict the income of a full-time 45-year-old female teacher who is at the top of the salary grid with the Calgary Board of Education. It would be foolish to rely on census data for female teachers instead of simply consulting the appropriate salary grid.

In most cases, it is not even necessary to concern ourselves with the predictions of a HALS model. If a plaintiff was a well-established welder and now he is unemployable due to an injury, HALS adds nothing to the estimate of his economic loss. However, suppose we have an individual whose disabilities are categorised as severe, but he continues to work in his pre-accident job and is not currently experiencing a loss of income. Might this be an occasion when the HALS approach is especially useful in estimating his loss of income, due to the uncertainty regarding how his injuries will affect his future earnings? Probably not. To begin with, the fact that the plaintiff is not currently experiencing a loss of income suggests that he is unlike the average HALS individual. It is an awkward but unavoidable fact that a statistical model will not do a good job of predicting outcomes for “outliers”. That is, if we create a predictive statistical model using a certain sample group, the model’s predictive power diminishes if the subject under consideration is very much unlike the average member of the sample group. But let us ignore this problem for now.

Perhaps we could assume that, in the future he will be more like the average and will experience that 25 percent loss, on average over the remainder of his work-life. This immediately leads to a logical problem that should give plaintiff lawyers pause before relying on such an assumption. If one wants to argue that a plaintiff who is not now experiencing a loss of income will become just like the HALS average in the future, then what of the plaintiff who is now experiencing a loss of income greater than the predicted 25 percent? The reasoning above suggests we should assume that his earnings will improve to only a 25 percent loss, on average, over the remainder of his work-life. This reasoning is, of course, faulty. When we observe a person experiencing less than the expected income reduction, the reasonable conclusion is that he is one of the individuals whose disability has a relatively mild effect on his earnings. The conclusion is not that his earnings gap will widen in the future, as this effectively ignores the additional information conveyed by the his current income. Parallel reasoning applies when we have a person experiencing a greater than expected income reduction.

To be clear, it could be the case that the working plaintiff who is not currently experiencing a loss of income will indeed experience one in the future. However, I do not believe that the loss will be supportable using HALS alone. In such a case, the HALS data would tell us that the individual is currently performing better than his disabled peers (on average), but we still need more evidence to find that he will have a future loss. That evidence may be available from medical experts, vocational experts, or the plaintiff’s employer. Perhaps there is evidence that the plaintiff faces a greater chance of future unemployment, or is likely to retire early due to his residual deficits. These factors will lead to a loss of income and they can be explicitly incorporated in our calculations – there is no need to appeal to HALS averages. Alternatively, it may be the case that the plaintiff is not now experiencing a loss of income because the injuries are not affecting his ability to earn income and never will. In that case we might be left with a “loss of capacity” argument, which I will not address here.

To summarise, I believe that in most cases when we have an adult plaintiff, the HALS approach is not going to be especially useful in determining his loss of income. It simply provides a useful baseline to compare a particular plaintiff to his disabled peers, in the same way that census income averages tell us how a particular 45-year-old female teacher’s earnings compare to her same-age peers.

There are cases in which I think the HALS approach could be useful, and these are when we know very little about how a disability will affect a person’s employment and earnings. For example, in the case of a child who is injured, we could use HALS to predict the impact on her future earnings. Even in such circumstances, the HALS approach would still be limited in at least two ways. First, the HALS approach will only be valid if the child’s expected educational attainment is unaffected by the injuries. Second, in such a case we would also need a HALS model that can be restricted to those adults who were injured when they were children, since there will certainly be a difference in the impact of (say) a severe mobility disability on earnings if the person is injured at age 10 versus if she is injured at age 40. This restriction will add to the sample size problems I noted above. For an injured adult the HALS approach could be useful if there remains a great deal of uncertainty regarding how her earnings will be affected. For example, in the case of a plaintiff who has been out of the labour force for many years (due to parenting responsibilities perhaps) and who has not yet attempted to re-enter the labour force.

In these cases however, like all others, we must remain willing to discard the HALS averages if we have better information about how the plaintiff’s income will be affected. It is not satisfactory to say that because the loss of income is difficult to determine, HALS will yield our best estimate. In most cases we can do better, because we are not predicting the income of a randomly selected disabled individual. Instead we are predicting the income (and loss) of a specific individual about whom we know a great deal. The fact that we have a HALS model at our disposal does not mean that we should ignore the facts of our specific plaintiff.

leaf

Derek Aldridge is a consultant with Economica and has a Master of Arts degree (in economics) from the University of Victoria.

The Impact of Disability on Earnings: Reliable Data

by Christopher Bruce

This article first appeared in the spring 2005 issue of the Expert Witness, though it is based on a paper that Dr. Bruce presented at the Canadian Bar Association national conference, “Hot Topics in Litigation,” in Toronto on April 16, 2005.

In a previous article in this newsletter, “The Reliability of Statistical Evidence Concerning the Impact of Disability,” I argued that the courts should be very cautious when relying on evidence concerning the effects of disability on earnings. In this paper, I summarise some of the statistics on this factor that I consider to be reliable.

Criteria

Before a data set can be used with confidence, it must meet two criteria. First, the number of observations must be large enough that one can be certain that a representative sample has been drawn of all relevant populations. This means, first, that the sample must include individuals both with and without the disability in question; and, second, that the sample of the disabled population must be large enough that the results are not affected by accidental inclusion of unrepresentative individuals. For example, if one Canadian in a thousand has a particular disability, it might be necessary to survey one Canadian in three hundred in order to obtain a sample of sufficient size (in this case, one hundred) to ensure that a few “outliers” did not affect the statistical findings. Second, the observations must be drawn in a sufficiently random manner that the researcher can be confident that the individuals in the sample are representative of the population of interest. For example, it might not be appropriate to rely on a follow up survey of one hundred patients from a hospital that attracted an unrepresentative group of patients – unless the plaintiff was known to fall into that group.

My experience suggests that there are two sources of data that best meet these criteria: data sets constructed by national statistical agencies, such as Statistics Canada and the U.S. Bureau of Labor Statistics, and certain of the large, longitudinal studies – such as the National Longitudinal Survey or the Panel Study on Income Dynamics – that have been conducted by reputable research institutes in the United States. When employed by well-trained researchers, using appropriate statistical techniques, these data provide information on which the courts can rely. In the following sections, I summarise some of the studies that I believe meet the criteria set out above.

Spinal Cord Injuries

One of the most widely-studied groups of victims is those who have suffered from spinal cord injuries – paraplegia and quadriplegia. Fortunately, within the dozens of studies that have been conducted, there is a small set that employ large, reliably-drawn sets of data and appropriate statistical techniques. I particularly recommend three of these:

  • Bruce, Christopher (2004) Assessment of Personal Injury Damages, 4th Edition, (Butterworths: Toronto), Chapter 8 (with Hao Wang).
  • Krause, J. Stuart, et. al. (1999) “Employment After Spinal Cord Injury: An Analysis of Cases from the Model Spinal Cord Injury Systems” Archives of Physical Medicine and Rehabilitation 80, November, pp. 1492-1500.
  • Krueger, Alan, and Douglas Kruse (1995) Labor Market Effects of Spinal Cord Injuries in the Dawn of the Computer Age, (National Bureau of Economic Research: Cambridge, MA), Working Paper 5302.

The data in my book are the most representative of the total population (both disabled and non-disabled) as they are taken from the 1990 Canadian census. However, as the census identified individuals by impact of disability rather than cause, I was forced to use “unable to walk or carry light objects” as my disability category, rather than “spinal cord injured.” The Krause et. al. and Krueger and Kruse data were less representative than mine, as the U.S. census does not provide detailed information about disabled individuals. Instead, both studies relied on concerted efforts by research groups to gather data without government assistance. This meant that, although both were able to obtain large data sets that specifically concerned individuals with spinal cord injuries, they were unable to ensure that their data were truly randomly drawn.

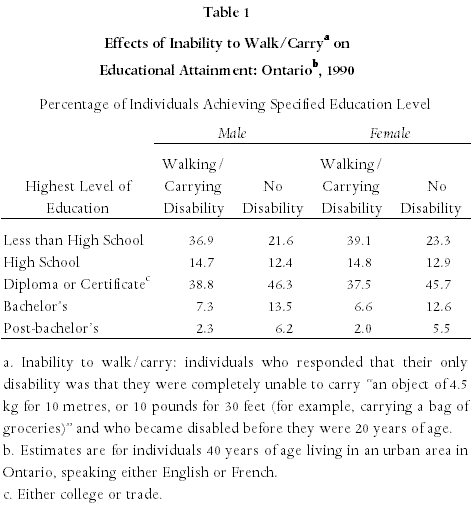
Nevertheless, the three studies provide compelling evidence concerning the impact of spinal cord injuries on labour market outcomes. First, because of the size and breadth of my sample, I was able to divide my data between those who had been injured before they were 20 years old and those who were injured later. This allowed me to investigate the effect that “inability to walk” had on the educational attainment of young disabled individuals. I found that non-disabled individuals were approximately twice as likely to complete a university education as were disabled; and were correspondingly much less likely to drop out of high school. (See Table 1.)

Table 1

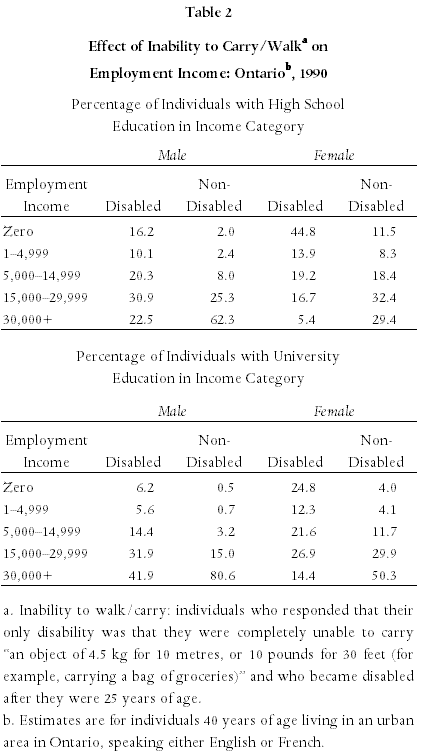
Conversely, by restricting a second sample to those who became disabled after they had completed their education, I was able to investigate the effect of “inability to walk/carry” on earnings, holding education constant. Here I found, first, that the disabled were much more likely than the non-disabled to be earning either no income or subsistence wages. Among those with high school education, for example, 26.3 percent of disabled males and 68.7 percent of disabled females earned less than $5,000 per year (in 1990), whereas the comparable figures for the non-disabled were only 4.4 percent and 20.1 percent, respectively. (See Table 2.)

Table 2

Second, there was a dramatic difference between the probabilities that the disabled and non-disabled would have earnings in the highest income category. Even after “correcting” for age, sex, educational level, province of residence and a number of other variables, I found that those who were unable to walk were less than half as likely to earn over $30,000 as were those who reported no disability.

Krause, et. al., lacking data concerning the non-disabled, could only comment on the factors that affected the probability that a spinal cord injured individual would be able to find employment. Most importantly, they found that if the individual had been employed at the time of the injury, he/she was almost four times as likely to be working after the injury as if he/she had not been so-employed; and that those spinal cord injured with a university education were three times as likely to be employed as were those with less than a high school education.

Krueger and Kruse were able to provide information concerning both employment and earnings. Perhaps their most important finding was that, even after allowing for age, sex, education, race, and marital status, victims of spinal cord injury were much less likely to be employed than were the non-disabled. Specifically, whereas approximately 75 percent of the non-disabled in their study were employed, the comparable probabilities for the sub-categories of spinal cord injury were: incomplete paraplegic, 42.2 percent, complete paraplegic, 29.5 percent, incomplete quadriplegic, 27.6 percent, and complete quadriplegic, 22.2 percent. That is, they found that the most common outcome of spinal cord injury was that the victim became competitively unemployable.

They were also able to confirm Krause’s finding that individuals with university education were three to four times more likely to be working after injury than were those with high school education or less. Whereas only 10 to 15 percent of those in the latter group were employed, 50 to 60 percent of those in the former were working post-injury.

With respect to those who did manage to obtain employment, Krueger and Kruse found that the earnings of the spinal cord injured were approximately 40 percent lower than the earnings of a matched set of non-disabled individuals. For each injured individual who had been working before his/her injury, Krueger and Kruse identified a comparable individual at the same workplace who had not been injured. They then compared the earnings of the injured and non-injured workers approximately five years after the injury occurred. Of this differential, approximately half arose because the injured parties worked fewer hours per week and half because they had lower hourly earnings.

Chronic Pain

In a recent paper, Crook et. al. ? Determinants of Occupational Disability Following a Low Back Injury: A Critical Review of the Literature,” Journal of Occupational Rehabilitation, 12 (4), December 2002, 277-295. surveyed the entire literature on the effects of chronic pain. Interestingly for the argument I made in my previous paper, they found that less than one percent of research studies they identified (19 out of 2,170) met a basic set of criteria for methodological reliability. Those studies reported that victims returned to work more quickly (following the onset of chronic pain) the younger they were, the greater was the availability of job modifications, the sooner they were referred for treatment, the less pain they had from standing and lying, and the greater was their flexibility. Males returned to work more quickly than females; and individuals with previous hospitalization or previous episodes of back pain took longer to return to work than did those without such histories.

Crook’s survey also found that females and older workers were the most likely groups not to return to work at all. Other factors making it more likely that patients would not return to work were: relatively large numbers of children at home and a lack of control over the workplace.

Finally, pain was more likely to be persistent, the older was the worker and the greater was the degree of depression.

Visually Impaired/Blind

I was able to identify only two studies of the visually impaired that provided data from large, statistically reliable sources.

  • Bruce, Christopher (2004) Assessment of Personal Injury Damages, 4th Edition, (Butterworths: Toronto), Chapter 8 (with Hao Wang).
  • Blackorby, Jose, and Mary Wagner, (1996), “Longitudinal Postschool Outcomes of Youth With Disabilities: Findings from the National Longitudinal Transition Study,” Exceptional Children 62 (5), 399-413.

The first of these is my own study, using Canadian census data for individuals who reported that they had difficulty, or were completely unable, to see “ordinary newsprint, (with glasses or contact lenses if usually worn).” The Blackorby and Wagner study is based on a survey of over 8,000 students who had been enrolled in special education classes at high schools across the United States and who had been interviewed between three and five years after completing secondary school. Although this group included individuals with other disabilities, it also included a substantial portion who reported “visual impairment.”

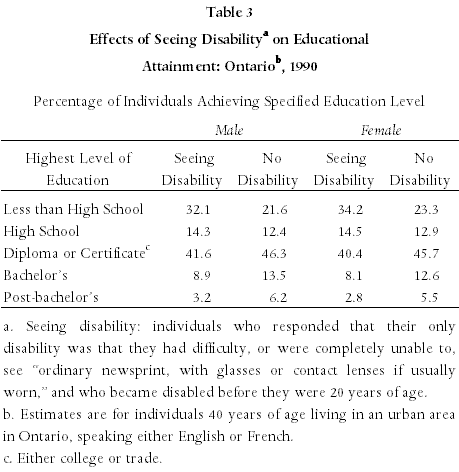
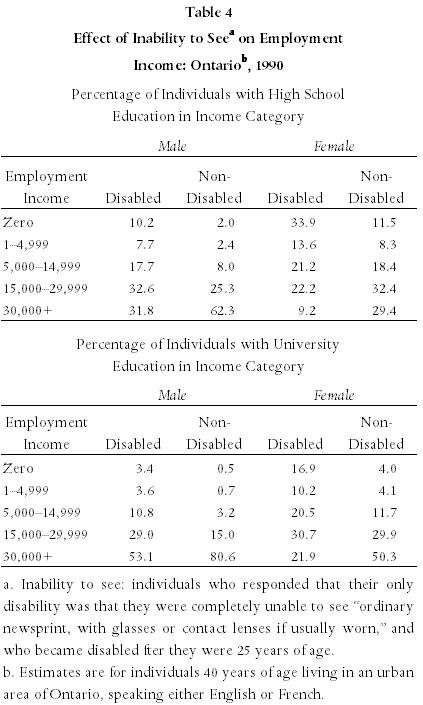
The main findings from my research are reported in Tables 3 and 4. There it is seen that although those with a seeing disability are only slightly less likely to complete advanced education than are the non-disabled, the former are much more likely to be found in the lower portion of the income distribution than are the latter.

Table 3

Table 4

These findings were confirmed in large part by Blackorby and Wagner. They found, for example, that 57 percent of visually impaired students had attended some form of postsecondary school, only slightly less than the 68 percent of non-disabled students. Nevertheless, they found that only 29.4 percent of the visually impaired were competitively employed – less than half of the 69 percent figure for the non-disabled.

Hearing Impaired/Deaf

The two most reliable sources of information about the hearing impaired are the same as for the visually impaired:

  • Bruce, Christopher (2004) Assessment of Personal Injury Damages, 4th Edition, (Butterworths: Toronto), Chapter 8 (with Hao Wang).
  • Blackorby, Jose, and Mary Wagner, (1996), “Longitudinal Postschool Outcomes of Youth With Disabilities: Findings from the National Longitudinal Transition Study,” Exceptional Children 62 (5), 399-413.

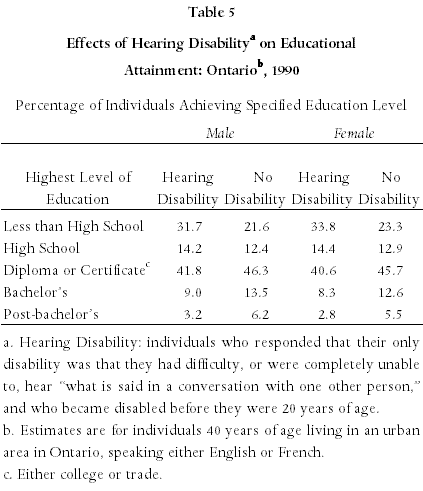
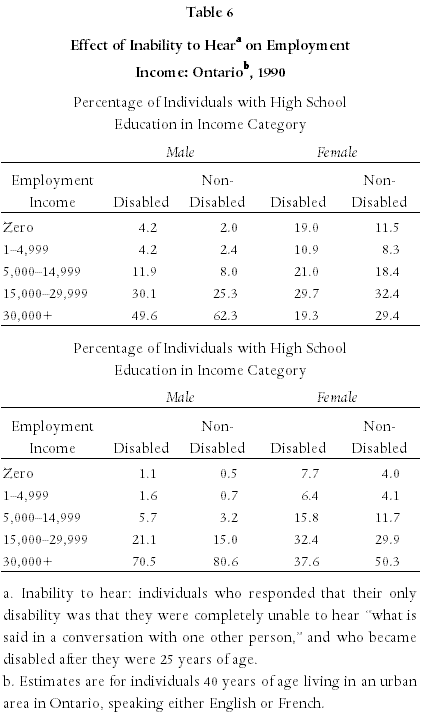
The main findings from my research are reported in Tables 5 and 6. As with the visually impaired, it is seen that those with a hearing disability are only slightly less likely to complete advanced education than are the non-disabled. The impact of hearing disabilities on income are much less, however, than is the impact of visual disabilities.

Table 5

Table 6

Again, these findings were confirmed in large part by Blackorby and Wagner. They found, for example, that 60 percent of hearing impaired students had attended some form of postsecondary school, only slightly less than the 68 percent of non-disabled students (and slightly more than the 57 percent of visually impaired). Similarly, they found that only 43.5 percent of the hearing impaired were competitively employed – almost 50 percent more than among the visually impaired.

Brain Injury

Two studies of the effects of brain injury appear to be based on large, representative samples. They are:

  • Dikmen, S. et al. (1994). “Employment Following Traumatic Head Injuries,” Archives of Neurology, 51 (2), 177-186.
  • Roberts, A.H. (1970) Severe Accidental Head Injury: An Assessment of Long-Term Prognosis (London: Macmillan)

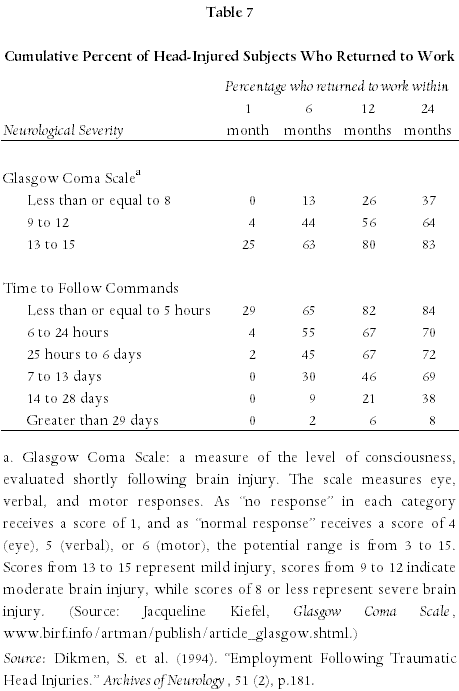
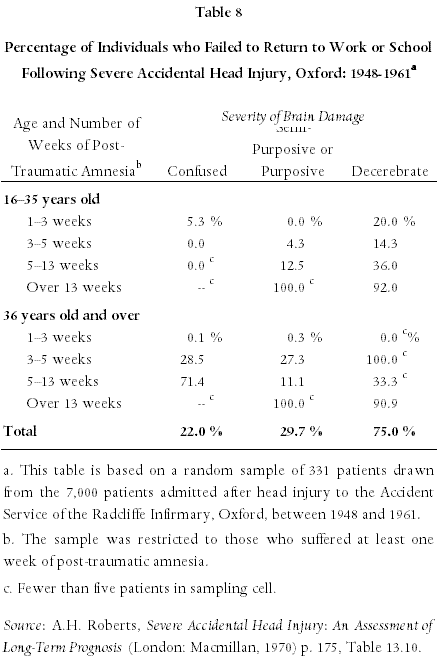
Both studies provide data concerning the probability of returning to work, given various measures of brain damage that are commonly available from medical reports. (See Tables 7 and 8.) As would be expected, the more severe is the injury, the lower is the probability that the individual will return to work. Also, the Roberts study found that workers were less likely to return to work, the older they were.

Table 7

Table 8

Discussion

In my experience, most medical/psychological evidence concerning the impact of disabilities on education, employment, and earnings takes two forms. First, the expert offers an opinion concerning the possibility that the plaintiff will be able to return to competitive employment. Second, the expert may offer an opinion concerning the (set of) occupation(s) for which the plaintiff can re-train if he/she cannot return to his/her pre-injury occupation. Typically, in the former case, no mention is made of the probability that the plaintiff will enter competitive employment, and in the latter case, no mention is made of the possibility that the plaintiff will work fewer hours than before the accident. Furthermore, in neither case will the expert make reference to the studies that provide statistics concerning these probabilities. Yet, as I have argued here, if one is diligent, and cautious, it is possible to identify numerous studies that provide reliable information on many aspects of the disability-employment relationship.

leaf

This article is based on a paper that Dr. Bruce presented at the Canadian Bar Association national conference, “Hot Topics in Litigation,” in Toronto on April 16, 2005.

leaf

Christopher Bruce is the President of Economica and a Professor of Economics at the University of Calgary. He is also the author of Assessment of Personal Injury Damages (Butterworths, 2004).

The Reliability of Statistical Evidence Concerning the Impact of Disability

by Christopher Bruce

This article first appeared in the winter 2004 issue of the Expert Witness.

Expert witnesses often testify that their experience, or the latest research, leads them to believe that a plaintiff’s injuries will have certain long-term physical, educational, or employment consequences. For example, the plaintiff’s injuries are predicted to worsen, or improve, along some projected time line. Or those injuries are expected to affect the probability that the plaintiff will be able to complete a planned educational program or enter a preferred occupation. Or an opinion will be given concerning the effect that certain disabilities will have on the income that the plaintiff will be able to earn.

When listening to such testimony, I am often reminded of Benjamin Disraeli’s famous complaint that “there are three kinds of lies: lies, damn lies, and statistics.” Expert testimony – particularly expert testimony with respect to the application of medical statistics to the determination of damages in personal injury cases – gives rise to three alternative interpretations that might be attached to Disraeli’s adage.

First, there is the sense in which I suspect Disraeli himself meant his quote: as a complaint that laypeople – judges and lawyers in this case, politicians in his – often find the (statistical) testimony of expert witnesses to be so confusing that they have difficulty distinguishing fact from fiction. That is, his was a call for more clarity; less use of obscure, technical language.

A second version might be recast as: there are “liars, damn liars, and those who abuse statistics.” This is a complaint against those who intentionally twist the interpretation of statistics, hoping either that the opposing expert has insufficient statistical knowledge to be able to recognise the deception, or that the court will have insufficient expertise to be able to determine which of the experts is telling the truth.

Finally, the sense in which Disraeli’s dictum is of greatest relevance to legal advocacy might be restated as: there are “liars, damn liars, and those who misuse statistics.” By this I mean the situation in which “experts” have insufficient knowledge of statistical analysis to realize that they have misunderstood or misrepresented the data that they are citing. My experience suggests both that this situation occurs with depressing frequency in personal injury cases, particularly with respect to medical statistics; and that opposing counsel allow these “misused” statistics to go unchallenged far too often.

The purpose of this paper will be to assist the courts to recognise the sources of statistical “misuse” and to institute methods of responding to the errors that arise. In a second paper, to be published in the next issue of the Expert Witness, I will report a number of statistics concerning the impact of disabilities on earning capacity, taken from sources that use reliable statistical techniques.

Sources of Statistical “Misuse”

There are three reasons why statistical evidence concerning the impact of disabilities on earnings might not be reliable. First, the expert may be basing his/her conclusions on past experience treating patients similar to the plaintiff, without taking into account the statistical uncertainties inherent in such an approach. Second, the expert, due to inadequacies in his or her own statistical training, may have misinterpreted data produced by a third party. Third, the expert may not have recognised that the data he or she is using to develop a prognosis were themselves collected or reported using unreliable statistical techniques. Examples of each of these types of error are discussed in this section.

1. The Expert’s Experience May Not Be Reliable

In many cases, experts drawn from the specialties that treat plaintiffs’ injuries – doctors, psychologists, physiotherapists, etc – rely upon their past experiences dealing with patients similar to the plaintiff to predict the impact that the plaintiffs’ injuries will have on his/her future ability to earn income. There are many reasons why the court should be reluctant to rely on this experiential evidence:

1. The plaintiff may not be representative of the patients that the medical expert normally treats: thus, the expert’s experience may not transfer easily to the plaintiff’s situation. For example, if the expert lives in a large city and the plaintiff comes from a rural area, the expert may not be familiar with the impact that a particular type of injury will have on the plaintiff’s ability to work on a farm. Or if the expert normally treats working-age patients, he/she may not be familiar with the impact of a particular type of disability on a senior or a minor.

2. If the medical expert has treated only a small number of individuals like the plaintiff, the sample size may be too small to draw statistically reliable inferences. For example, even a doctor who specialises in spinal cord injuries may have treated only a small number of quadriplegics. His/her experience with such a small number will provide only limited information concerning the plaintiff.

3. Even if the medical expert has treated a relatively large number of individuals like the plaintiff over his/her career, if the recommended treatment for those individuals has changed significantly recently, the expert may have treated only a small sample since that change. Again, the number of patients receiving the new treatment may not be sufficient to draw reliable inferences.

4. Often, the medical expert has been asked to comment on the impact that a disability has on employment, schooling, or earnings. As these are non-medical outcomes, the expert may not have systematically monitored them. Thus, the sample on which his/her information is based may be biased. For example, those patients who have adjusted well to their injuries, and who have returned to work, may be less likely to return to a doctor or psychologist for further treatment than those who have had difficulty adjusting. In this case, the doctor/psychologist may have developed an overly pessimistic view of the effects of the injury.

5. If the harm to the plaintiff is expected to continue for decades into the future and the medical expert has not been in practice long enough to have experience with patients whose treatment has continued for that length of time, the expert’s experience may not be reliable for predicting long-term consequences.

2. “Expert” Interpretation of Statistical Studies May Not be Reliable

When the expert attempts to supplement information drawn from his/her own experience with information drawn from studies conducted by third parties, a new set of problems arises. Specifically, the expert may lack sufficient knowledge or experience to be able to interpret statistical studies correctly:

1. The expert may have insufficient experience in the field to recognise deficiencies in the data. Many medical studies, for example, use a definition of “unemployment” that differs from that which is used by agencies such as Statistics Canada. The unsuspecting reader, who tried to compare the statistics drawn from the former with those drawn from the latter, could reach erroneous conclusions. Indeed, even within a reliable agency, such as Statistics Canada, similar-sounding names are often used to refer to quite different concepts. One must be careful, for example, to distinguish between “constant” and “current dollar” wages, between “net” and “gross” income, and between “real” and “nominal” interest rates. Failure to recognise these differences can lead to serious errors.

2. Because there is a lack of reliable data for predicting the effects of disability on labour market outcomes, experts are often forced to rely on data that were collected for other purposes. In many cases, this leads to the inappropriate use of such data. For example, doctors often use the American Medical Association “Guides to the Evaluation of Permanent Impairment” to calculate an index of the percentage of “whole body function” that has been lost due to an injury. Loss of an eye, for example, might be considered to reduce the patient’s “whole body” physical capacity by 25 percent.

Although the AMA did not design this index as a method of predicting the impact of disability on earnings, in the 1960’s and 1970’s it became common for experts to argue that a 25 percent reduction in whole body functioning implied a 25 percent reduction in earning capacity. Yet the connection between, say, loss of an eye or loss of a foot on the one hand, and loss of earnings capacity on the other is a tenuous one at best. Whereas loss of an eye could end the career of a professional athlete, for example, it might have very little impact on the career of an economist or lawyer.

Similarly, the rating system developed by Statistics Canada to categorise disabilities as mild, moderate, or severe yields statistics that are of very little value for predicting the effect of disability on the earnings of individuals within specific occupations. Yet many experts are currently using these statistics to make predictions of this nature.

3. The expert’s training in statistical analysis may be insufficient to allow him/her to distinguish reliable studies from unreliable ones. For example, studies that attempt to draw a connection between disabilities and labour market measures (such as income and employment) commonly rely on unsophisticated statistical techniques, making their conclusions very unreliable. Expert witnesses who are not well trained in statistical analysis may be unable to distinguish reliable studies from unreliable ones.

3. Published Studies May Not be Reliable

The most important problem facing the expert who wishes to predict the effect that disabilities will have on earning capacity is that many (if not most) of the statistical studies that have been published on this topic are unreliable. Some of the most important problems of which the courts should be aware include:

1. Many studies of the impact of disability on employment rely on very small samples. For example, it is not uncommon for articles on medical issues to study as few as 10 or 20 patients. Yet it is well known to statisticians that, in order to avoid the problem that “outliers” will bias statistical findings, it is usually necessary to have hundreds of observations.

2. Before the findings from a survey can reliably be projected to the population in general, it is crucial to ensure that the survey group is chosen in such a way as to be representative of the “population.” Many medical studies survey the patients from a single hospital or clinic, for example. But the findings of such a survey cannot reliably be projected to the general population if that hospital or clinic draws only from a sub-set of the population – for example, only from a relatively wealthy district or only from an urban population. And studies that attempt to contact patients many years after treatment may be biased in the sense that it may be easier to locate certain sub-sets of the group than others. For example, those paraplegics who have had the greatest success adjusting to their condition may be the ones who are most likely to have moved from the addresses they had at the time of admission to hospital and, therefore, may be the most difficult to reach at the time of the survey.

3. Although there are multiple factors that influence the effect of disability on employment and earnings, studies often collect information on only a small sample of these factors. For example, if older individuals are more likely to suffer from a particular disability (like arthritis) than are younger individuals, a data set that did not provide information about the ages of the individuals surveyed might appear to suggest that individuals with that disability earn higher average incomes than those who are not disabled (because individuals’ incomes tend to rise with age). Similarly, studies may overestimate the impact of a disability if more low-income than high-income individuals suffer from that disability.

4. Statistical studies can only show that variables – for example, disability and earnings – are correlated: they cannot show that one “causes” the other. That is, it is not clear whether disability causes low earnings, or whether occupations with low earnings have high accident rates. Labourers, for example, are more likely to experience on-the-job accidents than are office workers. If office workers earn more than labourers, data may appear to suggest that job-related accidents “cause” a significant reduction in earnings “because” those who have been injured earn less than the average person in the population. The more appropriate interpretation may have been that it was low income that had “caused” the accidents – that is, that it was the occupations with low earnings that had high accident rates.

One of the most common problems with medical studies is that they often do not report the age at which the disability became apparent. Yet we would expect that loss of a leg or an eye would affect individuals’ earnings differently if they were injured before they had completed their educations than if they were injured after they had established their careers.

What Can Counsel Do?

Medical experts often go unchallenged by the courts, even when they use unreliable statistical methods. How can the courts circumvent this problem, given that most lawyers and judges lack the expertise to question the bases of statistical testimony? I recommend three approaches:

1. If the opposing expert appears to be relying on his/her own experience as the basis for his/her predictions, at the “qualification” stage counsel should question the expert’s training in statistics. Do this not (necessarily) with the intention of convincing the court to reject his/her credentials, but to prepare the expert to agree with counsel that certain standards of data collection are important. Then use that agreement later to induce the expert to concede that his/her experience is inadequate for drawing reliable inferences.

2. Hire an expert in statistical analysis. Of those professions most commonly seen in court, actuaries and economists generally have the best training in advanced statistical techniques. Actuaries will have greater experience with life expectancy and fringe benefit data; while economists will have greater experience with data concerning education and incomes.

Other professions that also receive advanced statistical training are epidemiologists (often employed by medical schools) and statisticians (found in university departments of mathematics).

3. One option that is used occasionally in Canada, but less often than is justified, is to hire an expert in statistics to conduct original statistical analyses. As such an analysis is likely to cost at least $10,000-$20,000, it can not be justified for small, or “one-off” cases; but in a major injury case, in which the damages approach a million dollars, or with respect to the types of injury that counsel is likely to encounter many times, such an expenditure may well be justified. For example, my firm was hired by the defendants in one of the residential school sexual abuse cases. We used census data to estimate the earnings of individuals similar to the residents of those schools, but who had not been abused, and compared those earnings to the earnings of the plaintiffs. Similarly, in the second part of this paper (to be published in the next issue of the Expert Witness), I report the findings of a set of statistical analyses I conducted using Statistics Canada data, to determine the impact of various types of disabilities on educational attainment and income. These analyses could have been conducted by virtually any Ph.D.-trained economist in Canada.

leaf

Christopher Bruce is the President of Economica and a Professor of Economics at the University of Calgary. He is also the author of Assessment of Personal Injury Damages (Butterworths, 2004).

The Impact of Disability on Earnings: Results of the Health and Activity Limitation Survey

by Christopher Bruce, Derek Aldridge, & Kris Aksomitis

This article was originally published in the Spring 2000 issue of the Expert Witness.

The 1991 Census of Canada contained two questions that asked whether respondents considered themselves to be “disabled.” Using the answers to this question (and the answers to a second, preliminary survey), Statistics Canada was able to create a file of approximately 34,000 individuals that it considered to be disabled. These individuals were then asked to complete a lengthy, detailed questionnaire, known as the Health and Activity Limitation Survey, or HALS. Another (approximately) 100,000 non-disabled individuals were asked to complete a less detailed questionnaire.

As the HALS questions concerned factors such as health, income, and education, it held great promise for use in personal injury litigation. Indeed, it is possibly the most extensive and reliable study of the disabled that has ever been conducted (not just in Canada, but worldwide). And one does see allusions to HALS data in many experts’ reports. But, for various statistical reasons, the data that have been released by Statistics Canada have proven to be less valuable than might have been hoped. As a result, to those of us working in the field of damage assessment, HALS has been a great disappointment.

Economica recently obtained a copy of the answers provided by each of the respondents to the HALS survey. From these data we have extracted a number of statistics that we believe will be of interest to the personal injury litigation community. Although we cannot hope to resolve all of the problems previously associated with HALS data in this short article, it is our expectation that the data presented here will, nevertheless, be of value.

Earnings

We have obtained earnings data for both males and females, divided into four age groups, four education levels, and four levels of severity of disability; that is, for 128 categories in total. (128 = 2 x 4 x 4 x 4). For each of these 128 categories we calculate three figures:

  • The average earnings of individuals in the category who had at least some earned income, as a percentage of the average earnings of non-disabled individuals in that age/sex/education category who had some earned income.
  • The percentage of individuals in the category who had some earned income.
  • The average earnings of all individuals in the category, as a percentage of the earnings of all non-disabled individuals in that age/sex/education category. (This category differs from the first because it includes individuals who reported no earnings.)

We present these data in Tables 1a & 1b (pages 5 & 6). Figures are shown for each of the four education levels: less than high school, high school, college or trade certificate, and university. As one would have expected, in each category earnings rise as one moves from non-disabled through mildly, moderately, and severely disabled. (We define “mild,” “moderate,” and “severe” disability in an Appendix to this article, thus allowing readers to determine to which of those categories individual plaintiffs belong.)

In virtually all categories, it is seen that the predicted effect that disability will have on earnings is lower if it is known that the individual will be working than if it is not known whether he or she will be able to work. That is, the earnings of the disabled are a higher percentage of the earnings of the non-disabled among the working population than they are among the total population. This is because a higher percentage of the disabled than the non-disabled earn no income.

For example, among males aged 35-44 with a high school education, those with a “moderate” disability earned 68 percent as much as the non-disabled if they earned anything at all. But 38 percent of the moderately disabled individuals in this age/sex/education group reported that they had no earnings, whereas only 6 percent of the non-disabled reported that they had no earnings. Thus, inclusion of those with zero earnings in the earnings figures had a much greater impact on the average earnings of the disabled group than similar inclusion had on the average earnings of the non-disabled. The result is that the earnings of all moderately disabled individuals in this group were only 45 percent of those of all non-disabled individuals.

Charts 1a & 1b (pages 7 & 8) offer a graphical depiction of the data shown in the tables – and allow the reader to more easily observe the overall trend implied by the data.

Education

The earnings data reported in Tables 1a & 1b may underreport the effect of disability on earnings. The reason for this is that the disabled have lower education levels than do the non-disabled. If these lower levels result from the disability, then disability will have two effects: reducing earnings at each education level (Tables 1a & 1b) and reducing education levels.

In Table 2 (page 9), we report the distribution of education levels among the four categories of disability. It is seen in that Table that there is a higher percentage of university graduates among the non-disabled than among the disabled in every category; and a lower percentage of individuals who have not completed high school among the non-disabled than among the disabled in most categories. An interesting result is that mildly disabled males are much more likely than non-disabled males to have a college education or trade certificate. (However, this could occur if individuals with this level of education had a high probability of incurring injuries that caused mild disabilities.)

Conclusion

The tables and charts presented in this article suggest that the incomes of the disabled are lower than those of the non-disabled for at least three reasons: the disabled earn less when they work, even if they have the same levels of education as the non-disabled; the disabled are less likely to earn any income than the non-disabled; and the disabled have lower levels of education than do the non-disabled.

However, although the data presented here may be of some interest to personal injury litigants, the level of aggregation is so great that it seems unlikely that these data will be able to provide more than background information to the litigation process.

Appendix: Determination of the Degree of Disability

The purpose of this Appendix is to allow readers to determine whether Statistics Canada would classify a particular plaintiff’s disabilities as “mild,” “moderate,” or “severe.”

Statistics Canada asked 25 questions (see below), grouped into four categories. In the first category, the respondent was allocated a “score” of 0 if he or she answered “no,” a 1 if he/she answered “yes, but able,” and a 2 if he/she answered “yes, unable.” For example, the individual was allocated a 1 if he/she had difficulty hearing what was said in a conversation with one other person; and a 2 if he/she was unable to hear what was being said in such a conversation.

In the second category, the individuals were allocated a score of 1 if they answered “yes” to the question. (For example, “do you have difficulty with your ability to remember?”)

In the third category, individuals were shown a list of activities. If they were limited in their ability to engage in one of the activities they were allocated a score of 1; if they were limited in more than one of the activities they were allocated a score of 2.

Finally, individuals who had been diagnosed as legally blind received a score of 2.

The scores for all 25 questions were summed and individuals were allocated to the relevant levels of disability on the basis of their total scores. The scales used were:


LEVEL RANGE
Mild 1-4
Moderate 5-10
Severe 11-43


It will be apparent that these are very imprecise categorisations. For example, using Statistics Canada’s scale, both an individual who was legally blind and an individual with a weak back would be categorised as “moderately” disabled, even though a reasonable a priori expectation is that those disabilities would affect individuals’ earning capacities quite differently. Similarly, both paraplegics and quadriplegics would be categorised as “severely” disabled, even though, again, we know that those disabilities have quite different effects on earnings.

I. In this category, individuals receive 1 each time they indicate that they have difficulty with the activity, but are able to undertake it (“yes, but able”); and 2 each time they indicate that they have difficulty with the activity and are unable to undertake that activity (“yes, unable”).

1. Do you have difficulty hearing what is said in a conversation with

1.1 One other person?

1.2 A group of at least three other people?

2. Do you have any difficulty seeing the following when you wear your ordinary glasses or contact lenses?

2.1 Newsprint?

2.2 The face of someone across a room?

3. Do you have any difficulty speaking and being understood?

4. Do you have any difficulty:

4.1 Walking 350 metres without resting?

4.2 Walking up and down a flight of stairs?

4.3 Carrying an object of 4.5 kg for 10 metres?

4.4 Moving from one room to another?

4.5 Standing for more than 20 minutes?

5. When standing, do you have any difficulty bending down and picking up an object from the floor (e.g. a shoe)?

6. Do you have any difficulty

6.1 Dressing and undressing yourself?

6.2 Getting in and out of bed?

6.3 Cutting your own toenails?

6.4 Using you fingers to grasp or handle (such as using scissors)?

6.5 Reaching in any direction (e.g. above your head)?

6.6 Cutting your own food?

II. In this category, the individual receives 1 if he or she responds “yes” and 0 if he/she responds “no.”

7. Are you unable to hear what is being said over the telephone?

8. Do you have ongoing difficulty with your ability to remember or learn?

9. Has a teacher or health professional ever told you or a family member that you have a learning disability?

10. In the past, persons who had some difficulty learning were often told they had a mental handicap or that they were developmentally delayed or mentally retarded. Has anyone ever used those words to describe you?

III. In this category, the individual receives 1 if he or she responds “yes” with respect to one of the categories; and 2 if he/she responds “yes” with respect to two or more categories.

11. Because of a long-term physical condition or health problem (i.e. one that is expected to last longer than 6 months) are you limited in the kind or amount of activity you can do

  • At home?
  • At school?
  • At work?
  • In other activities (e.g. travel)?

12. Because of a long-term emotional, psychological, nervous, or psychiatric condition, are you limited in the kind or amount of activity you can do

  • At home?
  • At school?
  • At work?
  • In other activities (e.g. travel)?

13. Do you feel limited by the fact that a health professional has labelled you with a specific mental health condition, whether you agree with this label or not?

  • At home?
  • At school?
  • At work?
  • In other activities (e.g. travel)?

IV. Finally, if the individual had been diagnosed as legally blind, he/she was given a score of 2.

14. Have you been diagnosed by a specialist as being legally blind?

Table 1a: Earnings of disabled individuals compared to earnings of non-disabled individuals
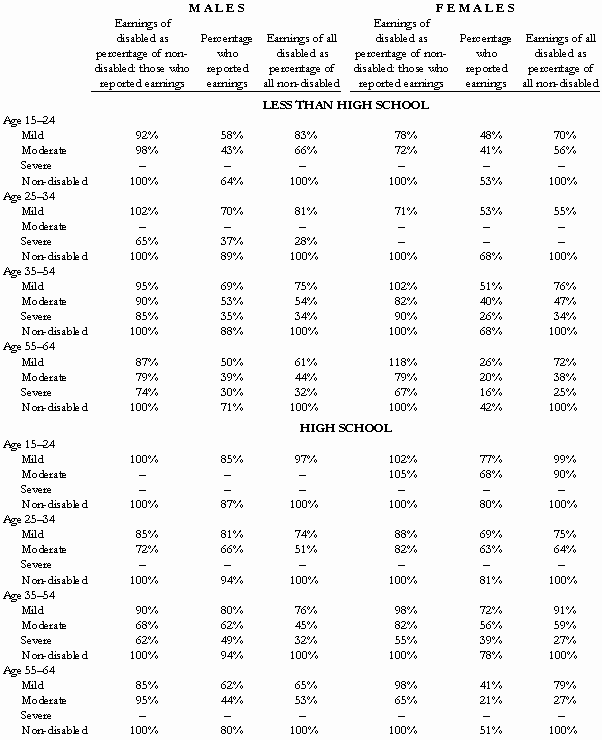
Table 1a

Note: A dash indicates that the category’s sample size is too small to report a statistically reliable estimate.

Table 1b: Earnings of disabled individuals compared to earnings of non-disabled individuals
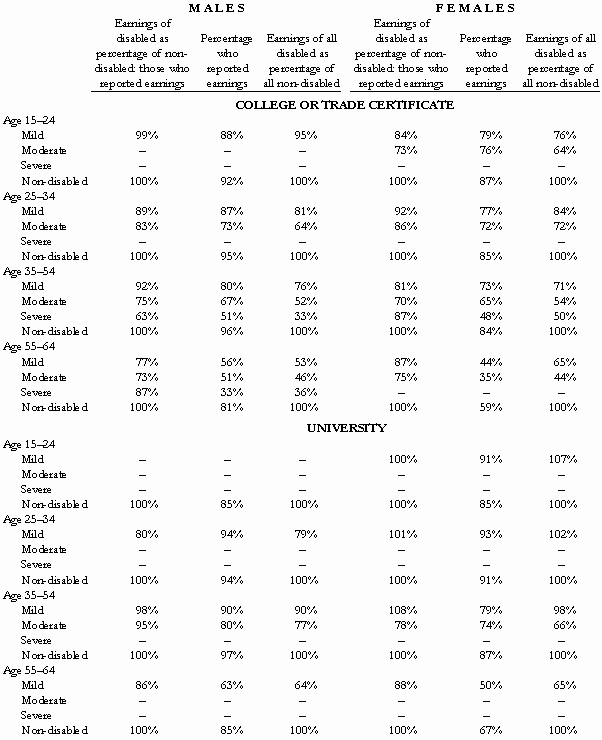
Table 1b

Note: A dash indicates that the category’s sample size is too small to report a statistically reliable estimate.

Chart 1a: Earnings of disabled males compared to earnings of non-disabled males
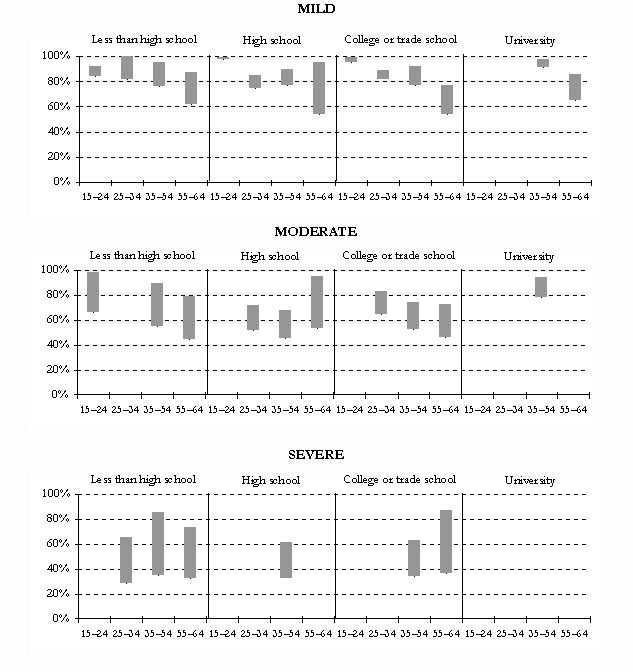
Chart 1a

Note: This chart graphically depicts the data shown in Tables 1a and 1b. The top of each bar represents the earnings of disabled males who reported earnings as a percentage of non-disabled males who reported earnings. The bottom of each bar represents the earnings of all disabled males (whether they reported earnings or not) as a percentage of all non-disabled males (whether they reported earnings or not). Where no bar is shown indicates that the category’s sample size is too small to allow us to report an estimate (corresponding to the dash in Tables 1a and 1b).

Chart 1b: Earnings of disabled females compared to earnings of non-disabled females
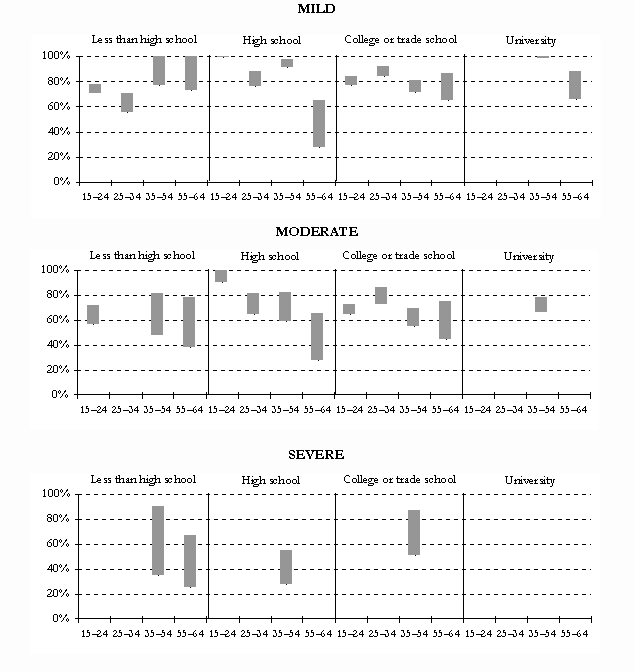
Chart 1b

Note: This chart graphically depicts the data shown in Tables 1a and 1b. The top of each bar represents the earnings of disabled females who reported earnings as a percentage of non-disabled females who reported earnings. The bottom of each bar represents the earnings of all disabled females (whether they reported earnings or not) as a percentage of all non-disabled females (whether they reported earnings or not). Where no bar is shown indicates that the category’s sample size is too small to allow us to report an estimate (corresponding to the dash in Tables 1a and 1b).

Table 2: The distribution of education levels among the four categories of disability
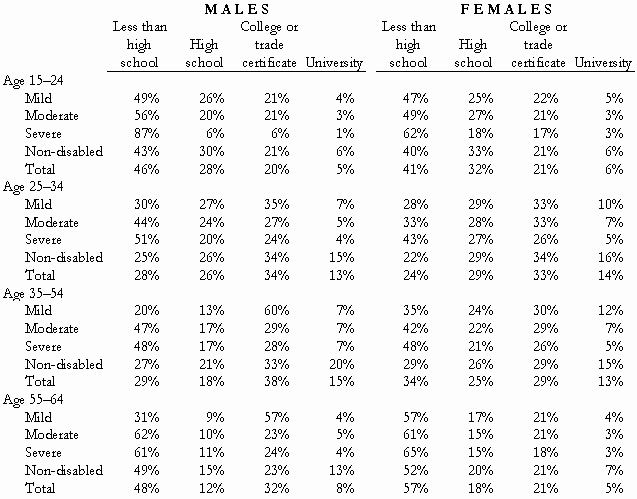
Table 2

leaf

Christopher Bruce is the President of Economica and a Professor of Economics at the University of Calgary. He is also the author of Assessment of Personal Injury Damages (Butterworths, 2004).

Derek Aldridge is a consultant with Economica and has a Master of Arts degree (in economics) from the University of Victoria.

Kris Aksomitis was a research associate with Economica and an MA student in Economics at the University of Calgary.
Two interesting web sites relating to disabilities

This article was originally published in the Spring 2000 issue of the Expert Witness.

We recently learned of two excellent web sites that may interest our readers. The first, titled Electronic Resources on Disabilities, contains a list of web site links which “identifies information sources on disabilities in general, assistive technology, associations and organizations, government resources, and sites centered on specific disabilities, as well as Web page accessibility.” You will find this site here.

The second site is the National Rehabilitation Information Center (NARIC). It can be found at www.naric.com. For 20 years, their staff “has collected and disseminated the results of federally funded research projects. NARIC’s literature collection, which also includes commercially published books, journal articles, and audiovisuals, averages around 200 new documents per month.” They are funded by the National Institute on Disability and Rehabilitation Research to serve anyone who is interested in disability and rehabilitation. One of their most interesting features is a monthly bibliography service that will email you a list of the latest documents that have been added to the REHABDATA database (within your specified area[s] of interest). You will find this service here.