This article was originally published in the Winter 2000 issue of the Expert Witness.
1. Introduction
Some of the largest personal injury and medical malpractice actions are brought on behalf of plaintiffs with chronic disabilities such as cerebral palsy, spinal cord injury, and traumatic brain injury. Such plaintiffs require extensive care and assistance for the rest of their lives, and the cost of future care is often the largest part of the claim.
There are three components to the calculation the present value of the cost of lifetime care:
- A discount rate, specifying the interest rate at which it is assumed the lump sum award will be invested.
- The dollar cost of providing care during each year. The rate at which this amount is assumed to grow over time is usually, though not necessarily, lower than the rate of discount.
- A probability distribution specifying the probability that the plaintiff will live to each possible age in the future. In the calculation of the present value of future costs of care, the cost of care in each possible year in the future is multiplied by the probability that the individual will live to the age at which that cost is required. This is equivalent to reducing the required cost by the probability that the plaintiff will not live to a given age and, therefore, that the plaintiff will not require the assumed cost of care. [Note that this is analogous to multiplying the annual loss of income by the probability that the individual would have been working during that year, in order to capture the effect of the probability that the individual would have been unemployed.]
When the injury is not one that reduces life expectancy, the survival distribution that is used is that of the general population. The distribution can be obtained from an ordinary life table. (In Canada, this is the Life Tables 1990-1992.) Our interest here, however, is the case in which life expectancy is reduced, and it is no longer obvious how the annual survival probabilities should be chosen.
2. Alternative methods of calculating the impact of reduced life expectancy
Typically, medical opinion concerning reduced life expectancy is conveyed in the form of an average number of years of expected survival. For example, the medical experts might agree that the effect of the plaintiff’s injury is to reduce her life expectancy from 50 years to 30. The question we wish to consider here is how economists should incorporate this opinion in their calculation of the changes in annual probabilities of survival. A number of alternative techniques are commonly used.
Life certain – A very simple technique is to assume that the plaintiff will live exactly the number of years estimated by the medical experts and then die. For example, a 30 year-old who has a probability of 1.0 of living to each age between 30 and 50, and a probability of zero of living to any age beyond that, has a life expectancy of 20 years.
Although this technique is sometimes used to obtain to obtain very rough approximations, it is certain to produce estimates that exceed the true value by a substantial amount. The reason for this is that the life certain approach leaves all of the costs of care in the immediate future, (in this case, in next 20 years). In reality, the plaintiff has some probability of dying during the next 20 years and a corresponding probability of living more than 20 years. Hence, in reality, the costs of care should be reduced in the near future (to allow for the possibility that the plaintiff will die before needing them) and increased in the distant future (to allow for the possibility that the plaintiff will live beyond 20 years). But, as discounting reduces the present value of ‘distant’ costs more than it reduces the present value of ‘near’ costs, moving costs further into the future will reduce the discounted value of future costs.
Rating up – A simple method for obtaining a probability of survival to each possible age in the future is to find a “statistical person” who has the life expectancy of the injured plaintiff and to use that person’s probability distribution to represent that of the plaintiff. For example, consider a boy with severe cerebral palsy who has an agreed upon life expectancy of 20 additional years. The rating up method identifies the age in the general population at which the life expectancy is likewise 20 years.
According to the U.S. Decennial life tables, for example, this is 58 years. For each future age, the probability of survival for a 58 year old is substituted for that of the 5 year old. For example, the 5 year-old’s probability of living to age 15 is assumed to equal the probability that an average 58 year old would live to 68.
The attraction of this method is that it provides a probability distribution with the correct average, (here, 20 years). There is a problem, however: it is the wrong distribution. As the research literature makes clear, a child with a short life expectancy is subject to a fairly constant risk over the life span; he may well die in the next few years but he also has a reasonable chance of living another fifty. By contrast, the man of age 58 is at a relatively low risk over the next few years, but his risk increases steeply over the decades and he has almost no chance of surviving another 50 years.
Like the life certain method, the rating up method places too many of the costs of care in the immediate future, and too few in the distant future (relative to the “true” values). Hence, it systematically overestimates the present value of future costs of care.
Relative risk – In this approach, the economist multiplies all the age-specific mortality rates in a standard life table by a constant. The constant is chosen to result in the desired life expectancy, and is easily determined by trial and error. For example, if the annual probabilities that a male will die are multiplied by 47, the life expectancy of a 5 year-old will become 20 years. Although the argument is more complex than that made with respect to rating up, the relative risk approach also systematically overestimates the present value of future costs.
3. An Example
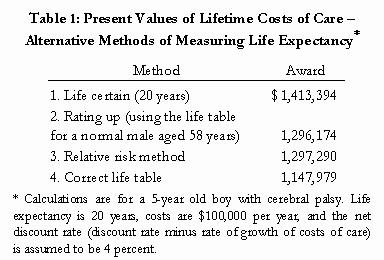
Table 1 shows lump sum awards for a 5 year-old boy with life expectancy 20 years who is to receive $100,000 for each remaining year of life. A discount rate of 4 percent is employed.

The first row applies to a hypothetical child who will survive exactly 20 more years. This is the life certain distribution discussed above, and it leads to the largest award: $1,413,394. The second row is the result of rating up to age 58, which currently, perhaps, is the most widely used approach. The award of $1,296,174 is appreciably smaller than the $1,413,394 of row 2.
Row 3 uses the relative risk method. As indicated above, when the mortality rates of a standard life table are multiplied by 47, the life expectancy for a boy of age 5 years becomes 20 years. This is the multiplier that has been used. The resulting award of $1,297,290 is very similar to that obtained from rating up. Finally, row 4 gives the award when the correct life table, based on the latest evidence concerning cerebral palsy, is used. Use of the correct probability distribution leads to an award of $1,147,979.
In this example, both rating up and the relative risk method lead to awards that are too high by 13 percent, or approximately $150,000. And the life certain method leads to an award that is too high by almost 25 percent.
4. Comparison of the methods
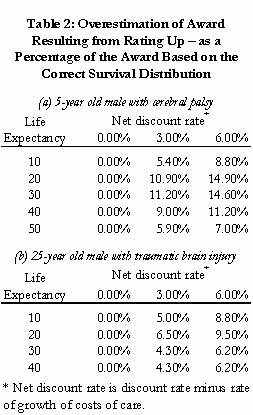
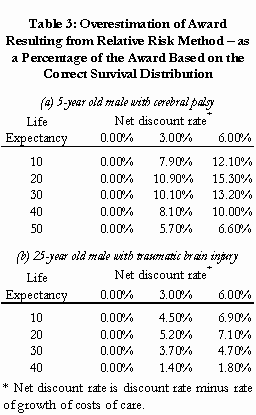
The size of the discrepancy between the approximate methods and the correct survival distribution depends on several factors, of which the most important are the cost schedule, the discount rate, and the plaintiff’s life expectancy. Discrepancies will tend to increase as the rate of growth of costs decreases, as the discount rate increases, and as post-injury life expectancy falls.
Tables 2 and 3 show the percentage overestimation for various discount rates with the rating up and relative risk methods, respectively. In addition to the case of a five year old with cerebral palsy (Tables 2a and 3a), we also consider that of a 25 year-old with traumatic brain injury and a life expectancy of 20 years (Tables 2b, 3b). As expected, the amount of overestimation decreases as the net discount rate (the discount rate minus the rate of growth of costs of care) decreases, and is negative when the net rate is negative.


5. Conclusion
To calculate the present value of the lifetime care of a disabled person we need more than a life expectancy – the whole life table is needed. We have seen that rating up and other approximate methods can lead to substantially different present values from the values derived from the correct life table. In the common case of positive net discount rates, the approximate methods systematically overestimate the correct values. These overestimates can often amount to more than $100,000. This is an issue that has received far less attention from the courts than it deserves.
![]()