Alternatives to the Minor Injury Regulation

by Christopher Bruce

This article first appeared in the summer 2009 issue of the Expert Witness.

Introduction

Between 2001 and 2003, average automobile insurance premiums for “all coverages” increased in Alberta by 33.2 percent, from $563 to $750. (See Bruce and Strauss, 2008.) In response to the public outcry that followed this increase, the Government of Alberta sought a method for constraining the growth of premiums. Accordingly, in October, 2004, it introduced the Minor Injury Regulation (MIR), which set a $4,000 limit on non-pecuniary damages for “minor” injuries.

As the MIR has been the subject of legal challenges, however, it is possible that the government may wish to consider alternative methods for reducing automobile insurance premiums. The purpose of this article is to canvass a number of techniques that have been suggested to achieve this by reducing the number and severity of accidents.

Specifically, I will survey the academic literature concerning the effects that the following policies can be expected to have on average claims costs: (i) mandatory fines for “driving under the influence” (DUI) offences; (ii) insurance surcharges following either DUI or “chargeable accident” events; (iii) increases in the minimum drinking age; (iv) a ban on driver use of cell phones; (v) mandatory use of alcolocks; and (vi) introduction of in-vehicle data recorders.

1. Mandatory DUI fines

A number of U.S. states have introduced mandatory jail terms and/or mandatory license revocation for first DUI offences. Both Sloan et. al. (1994) and Wagenaar et. al. (2007) found that these rules were associated with statistically significant reductions in numbers of fatal accidents. Nevertheless, both studies found that the absolute numbers of accidents avoided were small. The Wagenaar study, for example, found that the introduction of these mandatory measures implied that the number of individuals killed by drivers with blood alcohol content over 0.08 was approximately 13 per year per state ? a number that was worth achieving, but which would not reduce accident premiums by a significant amount.

2. Insurance surcharges for DUI and “chargeable accident” offences

Sloan et. al. (1994) also found that, among drivers over age 21, the imposition of a “substantial” premium surcharge for DUI or chargeable accidents led to fewer fatalities. The size of the surcharge, however, had to be in excess of 50 percent before it had a significant impact.

3. Raising the minimum drinking age

In 1984, the federal government in the United States began to use offers of highway funding to induce states to raise their minimum legal drinking ages (MLDA) to 21. A large number of statistical studies have been conducted to determine the effects that this policy has had on alcohol consumption among drivers in the 18 to 22 year-old age group; and on alcohol-related traffic accidents caused by drivers in these groups.

In a survey of 241 empirical analyses of MLDA that had been conducted prior to 2001, Alexander Wagenaar and Traci Toomey (2002) found that the “? preponderance of evidence?” suggested that an increase in the minimum legal drinking age was associated with a reduction in both the level of alcohol consumption among young people and the number of traffic crashes attributed to them.

Recently, Carpenter and Dobkin (2009) confirmed that MLDA laws had had a significant effect on the consumption of alcohol. 19 and 20 year-olds, for example, consumed between 11 and 21 percent less than comparable 21 year-olds. Furthermore, this reduction in consumption was associated with a 15 percent reduction in the vehicle-related mortality rate.

Similarly, Fell et. al. (2008) found that the introduction of the MLDA had resulted in an 11 percentage reduction in the ratio of drinking to non-drinking drivers aged 20 or younger who were involved in fatal car crashes. (That is, among those who were involved in fatal accidents, a smaller percentage had been drinking.) Furthermore, they also found that the most important deterrent to underage drinking was enforcement of strict rules against the use of false ID.

4. Restricting driver use of cell phones

Although it appears that most members of the public are convinced that driver use of cell phones increases the risk of accidents, it is difficult for researchers to obtain objective evidence concerning this issue.

The earliest studies, which investigated driver behaviour under laboratory conditions, found that driver reaction time was slowed when using cell phones. (McCartt, et. al. (2006).) But, as researchers were concerned that laboratory behaviour might not translate into driving behaviour under actual traffic conditions, innovative techniques were devised to draw connections between cell phone use and accident rates.

One technique, employed by Kolko (2009), was to correlate state-level data on mobile phone ownership with “hands-free” laws and traffic fatalities. He found that increased mobile phone ownership was associated with an increase in the number of traffic fatalities, “but only in bad weather or wet road conditions” (p. 21). He also found some evidence that hands-free laws reduced fatalities, but concluded that the effect was only minor.

A study conducted in Toronto (Redelmeier and Tibshirani, 1997) used a technique called case-crossover design to extract the effect of cell phone use on accident probabilities in real world applications. They obtained the cell phone records of approximately 700 drivers who had been involved in accidents that had caused “substantial” property damage, but that had not caused personal injury. Using these records, they were able to compare the degree of cell phone use of those drivers in the 10 minutes prior to the accidents with the use rates in comparable 10 minute periods on previous days.

If cell phone usage had no effect on accident activity, the researchers would have found that the same percentage of drivers were using their cell phones on the (previous) days when they did not have accidents as were using their phones on the days that they reported accidents. What Redelmeier and Tibshirani found, however, was that when drivers used a cell phone, the risk they would have an accident was approximately four times as high as when they did not use a phone. Significantly, they concluded that this risk was “?similar to the hazard associated with driving with a blood alcohol level at the legal limit.” (p. 456) They did not find, however, that the risk of an accident was lowered if drivers used a hands-free phone.

A similar, case-crossover design was subsequently used in Western Australia (McEvoy, et. al., 2005) to investigate approximately five hundred drivers who had been involved in automobile crashes that necessitated attendance at hospital. Using cell phone logs, that study confirmed the Toronto study’s finding, that drivers who had used a cell phone within ten minutes before a crash were four times more likely than non-users to have been involved in a serious crash.

In a Vancouver study (Wilson, et. al., 2003), observers stationed at street corners determined whether drivers were using cell phones. If they were, their license plate numbers were recorded, thus allowing researchers to compare cell phone use with Insurance Corporation of British Columbia records concerning automobile insurance claims. It was found that those drivers who had been observed to be using cell phones were significantly more likely than the average driver to have made at least one “at-fault” crash claim in a previous four year period. This finding was much stronger for female drivers than for male.

All of these studies shared the problem that there had been no direct observation of the drivers at the time that the accident occurred. To resolve this issue, the U.S. National Highway Traffic Safety Administration (NHTSA) fitted approximately one hundred cars with both video cameras ? to record both the driver’s actions and the events on the road immediately around the vehicle ? and electronic sensors ? to measure such aspects of the automobile’s actions as speed, acceleration, deceleration, and sudden turns.

The in-car video recorders were able to monitor the drivers’ cell phone use and the degree of their attentiveness to the road. The remaining video recorders could record traffic conditions; while the electronic recorders could measure the driver’s responses to external events.

After observing each car for more than a year, researchers were able to conclude that the actions of (i) dialing a hand-held device and (ii) talking/listening to a hand-held device each contributed to 3.6 percent of all crashes and near-crashes. (NHTSA, 2006: p. 32) The sum of these two figures, 7.2 percent, is approximately equal to one third of the effect of driving while moderately or severely drowsy.

5. Alcolocks

The Swedish government has been experimenting with the use of “alcolocks” to reduce driving while intoxicated (DWI). These are instruments that lock a car’s ignition until the driver has blown into an alcohol-measuring device, (and recorded an alcohol level below the maximum permissible). In one experiment, Swedish drivers who had been convicted of DWI were enrolled in an alcohol ignition interlock programme (AIIP) for two years. Bjerre and Thorsson (2008) found that participants in the AIIP were more likely than non-participants to qualify for full reinstatement of their drivers’ licenses at the end of the two-year period; and that they were less likely to be in traffic accidents or to be charged with DWI offences after that period.

Alcolocks could be used to reduce traffic accidents in Alberta in two ways. First, they could be employed in a manner similar to that in Sweden, to assist in the rehabilitation of drivers who had been charged with DWI. Second, they could be employed by drivers who had been charged with DWI offences and who wished to obtain reduced insurance rates by providing evidence to their insurers that they were not driving while intoxicated.

6. In-vehicle data recorders

Computer systems in automobiles have advanced to the point that it is now a relatively simple matter to monitor and record not only engine performance but also driver performance. At a low cost, for example, in-vehicle data recorders (IVDRs, sometimes called event data recorders, EDRs), can keep records of actions associated with increased probabilities of accidents, such as rapid changes in acceleration or deceleration, sudden changes in direction, average speed, distance travelled, and time of day travelled. (See Bordoff and Noel, 2008, at p. 13, for a discussion of current IVDR technology.)

With the addition of a GPS system, information can also be obtained concerning the speed limits, road conditions (for example, ice or snow), weather, and traffic congestion in the areas travelled by the driver; and with the addition of an alcolock, information can also be provided about the driver’s blood alcohol content.

A number of insurance companies ? particularly Progressive and GMAC Insurance in the United States (McQueen, 2008) and, to a lesser extent, Aviva in Canada (Bordoff and Noel, 2008) ? have recognized that even IVDRs that lack GPS systems can be used to reduce automobile insurance premiums in two ways.

First, it will be possible to identify, and reward (with reduced premiums), those individuals who: are less likely than average to be involved in accidents because they drive relatively few kilometers, are unlikely to engage in risky behaviour (as measured by acceleration, deceleration, and sudden turns), drive at speeds at which few serious accidents occur, and drive at times of day that are associated with low accident frequency.

Second, and more importantly, the data from IVDRs could be used to induce drivers to reduce the probability they would become involved in accidents, either by reducing the distance they drove or by increasing the level of precautions they took. Drivers could either volunteer to reduce their risk exposure ? for example, by reducing the number of kilometers driven or decreasing the number of incidents of sudden acceleration or deceleration, as measured by the IVDR ? in return for reduced insurance premiums; or they could agree to pay increments in premiums based on increased risk, again as measured by the IVDR.

One variation on this possibility would be to disband the “Facility Association,” (the program that allows high risk drivers to obtain insurance at actuarially unfair rates), and to replace it with a program based on the use of IVDRs. That is, high risk drivers could be offered the opportunity to moderate their premiums if they would agree to reduce their accident-causing behaviour, as measured by IVDRs installed in their vehicles. (Note: drivers would not be “forced” to install IVDRs: they would be given the choice between paying actuarially fair premiums or providing evidence that their behaviour had changed in such a way as to justify lower premiums.)

Even when a GPS is not attached to the IVDR, research shows that the information that can be extracted from an IVDR is sufficient to induce changes in driver behaviour. In a thorough review of the evidence, for example, Jason Bordoff and Pascal Noel (2008), of the Brookings Institution, argued that the introduction of a system in which individual drivers’ automobile insurance premiums were directly correlated with numbers of miles driven (pay-as-you-drive insurance) would reduce the number of automobile accidents by eight percent.

Toledo et. al. (2008) found that the risk data collected by the IVDRs in their experiment were strongly correlated with the probability that drivers had been involved in at-fault accidents. Interestingly, they also found that even when drivers were told that the information from IVDRs would not be used to reward or punish them, crash rates declined by approximately 19 percent. The presence of the IVDR alone was sufficient to alter driver behaviour.

The primary concern with IVDRs that has been expressed in the literature (see, especially, Askland, 2006), is that they represent an invasion of the driver’s privacy. Two responses have been made to this criticism. First, if a GPS system is not attached to the IVDR, the data that can be collected ? average speed, distance driven, number of occasions of sudden acceleration or deceleration, etc. ? provide no more information about the individual than do the data already collected by the car’s odometer and engine monitoring system.

Second, as long as the individual is free to choose whether to install an IVDR and whether to provide the information stored in any such system to a third party, that information is no more invasive of the individual’s privacy than are questions that consumers already voluntarily respond to when seeking health or life insurance or consumer credit.

7. Conclusion

In the early 2000s, automobile insurance premiums rose dramatically in Alberta, Ontario, New Brunswick, Nova Scotia, and Prince Edward Island. In each of these provinces, the government responded by reducing the benefits that were available to drivers ? that is, by introducing a limit on the non-pecuniary damages that were available to plaintiffs who had suffered “minor” injuries.

In this article, I have argued that numerous alternative policies exist that could reduce premiums, not by reducing benefits, but by reducing the incidence and severity of automobile accidents. Some of these policies ? such as IVDRs and alcolocks ? are still under development, and others ? such as raising the minimum drinking age or banning cell phone use ? may be politically unacceptable. Nevertheless, a strong argument can be made, I believe, for presenting the evidence concerning these policies to the citizens of Alberta, to determine whether they consider the potential savings to outweigh the costs.

References

Askland, A. (2006) “The Double Edged Sword that is the Event Data Recorder,” 25 (1) Temple Journal of Science Technology, and Environmental Law, 1-14

Bjerre, B., and J. Kostela (2008) “Primary Prevention of Drink Driving by the Large-Scale Use of Alcolocks in Commercial Vehicles,” 40 Accident Analysis and Prevention, 1294-1299.

Bjerre, B., and U. Thorsson (2008) “Is an Alcohol Ignition Interlock Programme a Useful Tool for Changing the Alcohol and Driving Habits of Drink-Drivers?” 40 Accident Analysis and Prevention, 267-273.

Bordoff, J., and P. Noel (2008) Pay-As-You-Drive Auto Insurance: A Simple Way to Reduce Driving-Related Harms and Increase Equity, The Hamilton Project: Brookings Institution, (July).

Bruce, C., and J. Strauss (2008) “Premiums, Profits, and Costs of Business in Alberta’s Automobile Insurance Industry, 1996-2006,” 13(2) Expert Witness, 2-7.

Carpenter, C., and C. Dobkin (2009) “The Effect of Alcohol Consumption on Mortality: Regression Discontinuity Evidence from the Minimum Drinking Age,” 1(1) American Economic Journal of Applied Economics, 164-182.

Fell, et. al. (2008) “The Relationship of Underage Drinking Laws to Reductions in Drinking Drivers in Fatal Crashes in the United States,” 40 (4) Accident Analysis and Prevention, 1430-1440.

Kolko, J. (2009) “The Effects of Mobile Phones and Hands-Free Laws on Traffic Fatalities,” 9 (1) B.E. Journal of Economic Analysis and Policy.

McCartt, A., et. al. (2006) “Cell Phones and Driving: Review of Research,” 7 Traffic Injury Prevention, 89-106.

McEvoy, S., et. al. (2005) “Role of Mobile Phones in Motor Vehicle Accidents Resulting in Hospital Attendance: A Case-Crossover Study,” British Medical Journal.

McQueen, M. (2008) “How Technology Can Help Trim Auto Insurance,” Wall Street Journal, June 26; accessed on May 8, 2009 at http://online.wsj.com/article/SB121443810954605365.html.

NHTSA (2006) The Impact of Driver Inattention on Near-Crash Risk, DOT HS 810 594.

Redelmeier, D., and R. Tibshirani (1997) “Association Between Cellular-Telephone Calls and Motor Vehicle Collisions,” 336 (7) New England Journal of Medicine, 453-458.

Sloan, F., B. Reilly, and C. Schenzler (1994) “Tort Liability versus Other Approaches for Deterring Careless Driving,” 14 (1) International Review of Law and Economics, 53-72.

Toledo, T., O. Musicant, and T. Lotan (2008) “In-Vehicle Data Recorders for Monitoring and Feedback on Drivers’ Behavior,” 16 Transportation Research, Part C, 320-331.

Wagenaar, A., and T. Toomey (2002) “Effects of Minimum Drinking Age Laws: Review and Analyses of the Literature from 1960 to 2000,” Journal of Studies on Alcohol, Supplement No. 14, 206-225.

Wagenaar, A., et. al. (2007) “General Deterrence Effects of U. S. Statutory DUI Fine and Jail Penalties: Long-term Follow-Up in 32 States,” 39 (5) Accident Analysis and Prevention, 982-994.

Wilson, J., M. Fang, and S. Wiggins (2003) “Collision and Violation Involvement of Drivers Who Use Cellular Phones,” 4 Traffic Injury Prevention, 45-52.

leaf

Christopher Bruce is the President of Economica and a Professor of Economics at the University of Calgary.

Premiums, Profits, and Costs of Business in Alberta’s Automobile Insurance Industry, 1996-2006

by Christopher Bruce and Jason Strauss

This article first appeared in the winter 2008 issue of the Expert Witness.

Introduction

In February, 2008, Economica Ltd. was retained by the Canadian Bar Association to prepare a series of reports on automobile insurance premiums in five provinces: Alberta, Ontario, New Brunswick, Prince Edward Island, and Nova Scotia. We have now completed this work, having prepared two reports on Alberta and one on each of the other four provinces.

In this article, we summarise the main findings of the first of these reports, Alberta’s Minor Injury Regulation: Automobile Insurance Profits, Premium Rates, and Costs, prepared by Christopher Bruce, of Economica, and Jason Strauss, a Ph.D. student in the department of Risk Management and Insurance at Georgia State University. (The full text of this report can be found at: www.cba-alberta.org)

Our Report had three purposes:

  • to provide a measure of the profitability of automobile insurance in Alberta in the period 1996-2006, (that is, immediately preceding and immediately following the introduction of Alberta’s Minor Injury Regulation, the MIR, in the Fall of 2004);
  • to determine whether the observed changes in profits and premiums in the years prior to the introduction of the MIR had been caused by changes in costs; and
  • to identify what the effects on profits and premiums would be if the MIR was removed.

We summarise the results of our analyses in the three following sections of this article.

1. Profitability of Basic Coverage

As the MIR applied primarily to Basic Coverage, we focus in this section on that line of insurance. The methodology we use to estimate profits is based on the approach developed by the Insurance Bureau’s actuary, Mr. Joe Cheng, for his testimony in the case of Morrow v. Zhang (2008). (It was in Morrow that the constitutionality of Alberta’s Minor Injury Regulation was challenged.)

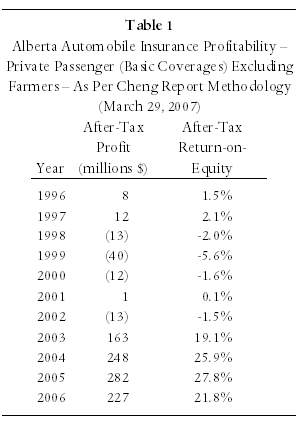
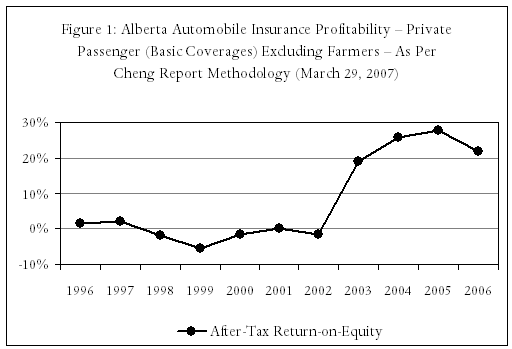
The most common measure of industry profitability (and the measure used in the Cheng Report), is after-tax “return on equity” (ROE) – that is, the industry’s after-tax profits divided by the value of the investments made in the industry. In Table 1 and Figure 1 (taken from our Report), we show that, prior to 2003, Basic Coverage was not profitable in Alberta, with an ROE ranging from -5.6 to +2.1 percent. In 2003, however, the return on Basic Coverage increased dramatically, to 19.1 percent, and rose above 20 percent in each of 2004, 2005, and 2006.

Table 1

Figure 1

1.1 Claims costs relative to total costs

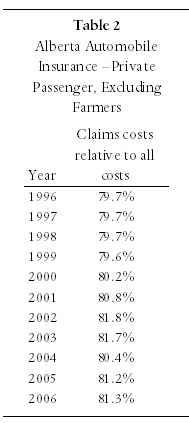
It is possible that the sudden increase in ROE in 2003 could have arisen from a dramatic change in the costs of claims. The data in Table 2, however, indicate that these costs remained a relatively constant portion of insurance companies’ total costs throughout the entire period 1996 to 2006. That is, the rate at which the costs of claims were rising was not appreciably different from the rate at which insurance companies’ other costs – primarily the costs of administration – were increasing.

Table 2

1.2 Claims costs relative to premiums

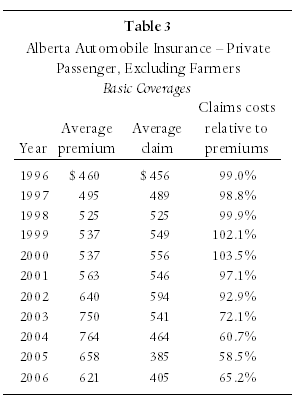
Alternatively, profits may have risen in the 2003/2004 period because claims costs fell relative to premiums. We investigate this possibility in Table 3, which reports changes in claims costs per motorist, relative to average premiums. What this table indicates is that, until 2002, premiums tracked claims costs fairly closely. That is, each increase in claims costs per motorist was matched by a similar increase in insurance premiums, resulting in a ratio of costs to premiums that varied only slightly. For example, while the average claim for Basic Coverage was 99.0 percent of the average premium in 1996, that ratio was 92.9 percent in 2002 – because premiums rose by 39.1 percent over that period, while average claims rose by a similar amount, 30.3 percent.

Table 3

In 2003 and 2004, however, premiums rose much more quickly than did claims costs, driving down the claims ratio. Between 2002 and 2004, for example, the average premium rose by 19.3 percent, while average claims actually fell by 21.9 percent. Thus, it appears that the dramatic increase in profit rates over the 2003-2004 period was driven, in large part, by a sudden change in the relationship between the costs of Basic Coverage and the premiums that were charged for that coverage. In the following section, we investigate a number of factors that might have led to this change.

2. Changes in Costs per Vehicle

The price of automobile insurance – the premium – is affected by four components. First, there are the average costs of claims (including adjustment expenses) per vehicle that were discussed in the preceding section. Second, allowance must be made for administration expenses (broker’s commissions, overhead, etc.). Third, insurers earn income from the investment of equity and reserves (premium revenue that will eventually be used to pay claims). Finally, a reasonable rate of profit must be added to net costs.

The question we address in this section is whether the increases in premiums between 1996 and 2004 can be attributed to changes in any of these components.

2.1 Average claims per vehicle

In Table 3, we showed that the cost of claims rose at approximately the same rate as the price of premiums over the period 1996 to 2002. Thus, if there was a need for increased premiums in 2003 and 2004, it was not because the ratio of claims costs to premiums had changed over the preceding six years.

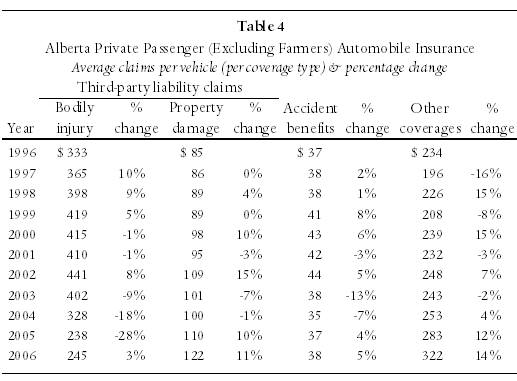
Nevertheless, Basic Coverage is composed of a number of sub-categories, including Third-Party-Liability and Accident Benefits. In turn, Third-Party-Liability (TPL) is composed of TPL-Property Damage and TPL-Bodily Injury, of which only the latter was affected by the Minor Injury Regulation (MIR). Thus, it is possible that even though claims costs for Basic Coverage as a whole did not increase in 2003 and 2004, there may yet have been an increase in the component that was affected by the MIR. To investigate this possibility, we report the data in Table 4.

Table 4

In this Table, it is seen that the claims for TPL-Bodily Injury increased at roughly the same rate as the other components of Basic Coverage prior to the MIR. For example, whereas claims for Bodily Injury increased by 32.5 percent between 1996 and 2002, claims for Property Damage increased by a similar percentage, 27.8.

We are led to ask, therefore, whether a change in some other element of the cost of insurance can explain the sudden increase in premiums that was observed in 2003 and 2004. In sections 2.2, 2.3, and 2.4 we analyze administrative expenses, investment income, and return on equity.

2.2 Administrative expenses

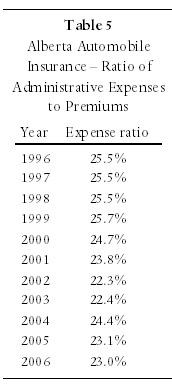
Table 5 reports that the ratio of administrative expenses to premiums (the expense ratio) decreased from 25.5 percent in 1996 to 23.8 percent in 2001. As average premiums increased only slightly over this period, the dollar value of expenses must have been decreasing or relatively stable. Furthermore, in the time period immediately prior to the introduction of the Minor Injury Regulation, 2002 and 2003, expense ratios fell further while premiums increased dramatically. It can be concluded, therefore, that changes in administrative expenses were not the source of the premium increases that occurred in 2002 and 2003.

Table 5

2.3 Return on investment

Insurance premiums are placed in a reserve until claims have to be paid. Those reserves are invested and the investment income generated thereby is credited against the cost of premiums. Hence, an increase (reduction) in the rate of return on investment, ROI, may lead to a decrease (increase) in premiums.

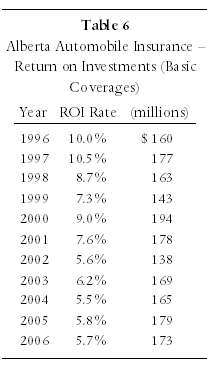
It is seen in Table 6 that the ROI insurers earned on their equity and reserves declined almost continuously over the period 1996 to 2001. Nevertheless, this decrease placed only limited upward pressure on premium rates. Specifically, we estimate that to compensate for the decrease in ROI from 9.0 percent in 2000 to 6.2 percent in 2003, insurers would have needed a $44 increase in the 2003 premiums on Basic Coverage. In fact, those premiums increased by $213, from $537 to $750. (See Table 3.) This confirms that decreasing ROI was not the primary impetus for the premium increases in 2002 and 2003.

Table 6

2.4 Return on equity

Once the net costs of insurance have been calculated, the premium is determined by adding a profit margin, or return on equity, ROE, to those costs. Thus, as the necessary ROE increases, premiums will also increase. We surveyed seven sources of expert opinion concerning the appropriate ROE target for the automobile insurance industry. We found:

  • Dr. Norma Nielson and Dr. Mary Kelly, in a presentation to the Alberta AIRB October 20, 2006, recommended an ROE in the range of 14.31 to 18.26 percent
  • NERA Consulting Economists, in a report for the Newfoundland & Labrador Board of Public Utilities, October 13, 2004, recommended an ROE in the range of 11 to 14 percent.
  • Based on NERA’s report, Dr. Ronald R. Miller of Exactor Insurance Services Inc. recommended an ROE of 12.5 percent.
  • Dr. Basil A. Kalymon, on behalf of the consumer advocate, recommended to the Newfoundland & Labrador Board of Public Utilities that the target return on equity for the setting of automobile insurance rates should be 9 to 10 percent.
  • The consumer representative to the Alberta AIRB, Ms. Merle Taylor, CMA, recommended that the ROE be higher than the allowable rate for utilities (at that time, 8.9 percent). She also stated that a 19.6 percent ROE would be “excessive.”
  • In his testimony in Morrow v. Zhang (2008), actuary Joe S. Cheng, F.C.I.A. stated that a 12.5% ROE was considered by many insurers to be in the low end of a reasonable range; and that the high end of a reasonable range might be 20%.

The Alberta Automobile Insurance Rate Board (AIRB) currently employs a formula that implies that an after-tax ROE of 9.5 percent would be appropriate.

Excluding the report by Merle Taylor, which did not give an exact range or recommendation, the average of the six remaining experts’ opinions concerning a reasonable ROE for automobile insurance is 12.76 percent. This figure is well above the rates earned on Basic Coverage in Alberta between 1996 and 2002, (see Table 1), but is well below the rates earned since then. Most importantly, Alberta insurance companies earned an ROE of 19.1 percent in 2003, the year before the introduction of the MIR.

2.5 Summary and conclusions

  • As indicated in the preceding sections, claims did not dramatically increase in the time period leading up to the Minor Injury Regulation.
  • As also shown above, administrative expenses did not increase but, rather, decreased in the time leading up to the Minor Injury Regulation.
  • Although investment returns decreased in the time leading up to the Minor Injury Regulation, their effect on the increase in premiums was minor.
  • ROE for Basic Coverage averaged -1 percent per year in the period 1996 to 2002 (7.4 percent for All Coverages). During this same period, average premiums for Basic Coverage only increased by 6 percent per year on average (4.5 percent per year on average for All Coverages). This premium deficiency (the difference between premium charged and premium required to reach a reasonable rate of return) appears to have been the primary impetus for the sharp increase in premiums that occurred in 2002/2003, as the “soft” market ended and a “hard” market began.
  • We estimate that without the premium increases in 2002 and 2003, ROE on Basic Coverage would have been -3.8 percent (in 2003).


3. Projected Effect of Removing the Minor Injury Regulation

Using the AIRB’s methodology, and controlling for other reforms beside the Minor Injury Regulation (i.e. controlling for the gross to net income reform and the collateral income reform), we estimate that the required average premium increase for Basic Coverage, if the Minor Injury Regulation had been removed, would have been $111.76/year if industry profits were to be maintained at their 2006 level, of 21.8 percent.

Alternatively, using the AIRB’s methodology, we estimate that insurer ROE for Basic Coverage would have been 12.2 percent in 2006 if the Minor Injury Regulation had been removed and premiums held constant. (Furthermore, in this case, the ROE would have been 16 percent for All Coverages.)

leaf

Christopher Bruce is the President of Economica and a Professor of Economics at the University of Calgary.

Jason Strauss is a Ph.D. student in the department of Risk Management and Insurance at Georgia State University.

The Impact of the “Net Income” Provisions of the Insurance Amendment Act, 2003

by Christopher Bruce

This article first appeared in the summer 2004 issue of the Expert Witness.

The Insurance Amendment Act, 2003, adds the following subsection to Section 626.1 of the Insurance Act:

(2) To the extent that an award is for or is determined with reference to loss of earnings, the amount of the award shall be reduced by

(a) income tax, if the award is not subjected to income tax,

(b) contributions by employees, and 50 percent of contributions by self-employed persons, under the Canada Pension Plan (Canada), and

(c) premiums under the Employment Insurance Act (Canada) relating to the state of being employed, that would be or would have been payable on or with reference to the lost earnings, both before and after the award, had the accident not occurred.

The purpose of this paper is to analyse the impact that this subsection will have upon the assessment of personal injury damages in Alberta. Four general topics will be discussed: calculation of “net income,” introduction of the “tax gross-up” claim, consideration of questions that remain unanswered, and impact of the amendment on the size of personal injury claims.

1. Calculation of “net income”

The effect of the Act is to require that a calculation be made of the plaintiff’s “net income” – that is, his or her income after deduction of income taxes, employment insurance premiums, and CPP premiums (payable by the employee) – in both the without-accident and the with-accident scenarios, both before and after trial. This adds two steps to the calculation of personal injury damages: a determination has to be made of the various types of deductions and tax credits that will be relevant to the plaintiff; and income taxes, EI premiums, and CPP premiums have to be calculated in each year of the plaintiff’s loss.

1.1 Income tax deductions and credits: An individual’s income taxes are affected by many factors other than earned income. Taxable income, for example, is found by deducting contributions to private and public pensions, union dues, and moving costs. And individuals are eligible for tax credits that are determined, in part, by age, marital status, disability, CPP contributions, EI premiums, medical expenses, educational expenses (for example, for a child’s university fees), and charitable donations.

Prior to the passage of the Insurance Amendment Act, none of these factors had to be taken into account in claims for personal injury damages. Now, all of these factors will have to be considered, not just for the plaintiff’s current situation, but also for all situations that might arise over the duration of the plaintiff’s injury. For example, if a young person has suffered a permanent injury, it will now be necessary to predict whether they would have married and had children; how many children they would have had, and when; whether they would have contributed to an RRSP; and, if so, how much and when.

1.2 Calculation of income taxes: One of the most important implications of the Insurance Amendment Act is that plaintiffs’ income tax obligations will now have to be calculated for every year of every scenario of their claims, from the date of the injury to the date on which the effects of the injury will have resolved, regardless of the size of those claims. In claims of short duration, it may be possible to obtain a rough estimate of these obligations simply by projecting the plaintiff’s past tax record forward. For example, if the plaintiff’s taxes were 20 percent of income in the year preceding the accident and he/she will now lose one year of employment (at the same employer, at a similar earnings level), it may be possible simply to assume that the lost income would also have been taxed at 20 percent.

However, if the plaintiff’s employment situation would have (or has) changed had the accident not occurred, or if the period of loss extends more than a few years, it will be necessary to calculate taxes for each period of the loss. Fortunately, a number of computer-based programs are available that will simplify such calculations. First, there are commercial packages such as QuickTax. Second, there is a number of free programs available on the internet. The most sophisticated of these is Canada Revenue Agency’s “TOD” program that can be downloaded from:

www.cra-arc.gc.ca/tax/business/tod

Also, a tax calculator that is much simpler to use, but provides less precision, is found on Ernst & Young’s website at:

www.ey.com/global/content.nsf/Canada/Tax_-_Calculators_-_Overview

In general, income taxes amount to approximately 15 to 25 percent of gross income. Hence, for most plaintiffs, the effect of the Insurance Amendment Act will be to reduce the size of their claim by that percentage.

1.3 Calculation of EI premiums: Employment Insurance premiums will also have to be calculated. However, this is relatively straightforward. For all annual incomes below $39,000, the employee pays 1.98 percent of his/her earnings. For all incomes above $39,000, the EI premium is capped at $772.20 per year. Hence, the maximum effect of this element of the Insurance Amendment Act will be to reduce plaintiff’s claims by less than 2 percent.

1.4 Calculation of CPP premium: Section 626.1(2) states that “…the amount of the award shall be reduced by… (b) contributions by employees, and 50 percent of contributions by self-employed persons, under the Canada Pension Plan (Canada)…” Perhaps surprisingly, this provision will have no effect on plaintiff claims, as it has already been the common practice for most financial experts to deduct these contributions.

This practice has been based on two observations: First, the employer and the employee make equal contributions to the CPP. Second, the present discounted value of the benefit payments from the CPP (once the employee has retired) is equal to (approximately) half of the present discounted value of the CPP contribution stream. (Essentially, the other half of the CPP contributions has been used to “top up” the Plan, which had been under funded.) Hence, restitutio requires that only half of the contributions to the employee’s CPP account be replaced. As the employee’s and the employer’s contributions are of equal value, one can replace half of the contributions by compensating the plaintiff for only one of the two sources. For example, one can compensate for only the employer’s contribution but not for the employee’s. This, in effect, is what the common practice has been in Alberta.

Thus, as the new Act mandates deduction of the employee’s contributions, but does not preclude addition of the employer’s contributions (a form of fringe benefit), it leaves the plaintiff in the same position in which he/she would have been before the Act. That is, the CPP provision of the Act will have no net effect on plaintiffs’ awards.

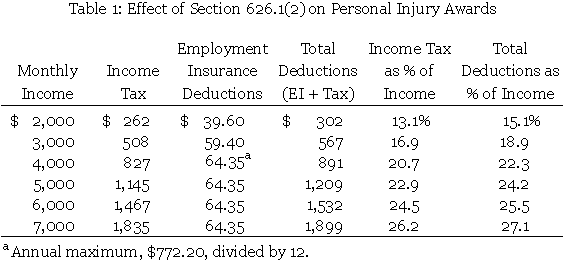
1.5 Sample calculations: In the attached table, I have calculated the impact of the Insurance Amendment Act on the loss of income claims of plaintiffs at various levels of income. In the calculation of income taxes, I have assumed that the individual has the minimum level of deductions and tax credits. Hence, the figures reported in the table should be taken as maxima. It is seen there that the effect of the Act will be to reduce awards by 15 to 25 percent.

Table 1

2. Income Tax

The Supreme Court of Canada has ruled, with respect to both fatal accident claims and claims for cost of future care, that if the annual loss is calculated net of income tax, the plaintiff is entitled to an “income tax gross-up” to ensure that the amounts available from the investment of the lump sum damages are sufficient to compensate the plaintiff for his/her future losses. As the Insurance Amendment Act does not explicitly prevent the courts from allowing a tax gross-up, it appears likely that they will allow this calculation. This means that, in every personal injury case in which the plaintiff’s damages are expected to affect his/her income for some time into the future, a tax gross-up calculation will have to be made.

2.1 The basis of the calculation: Assume that the plaintiff has lost a gross (before tax) income of $50,000 one year from now, that his income taxes on that amount would have been $10,000, and that the interest rate at which he can invest a lump-sum award is 5 percent. Prior to the passage of the Insurance Amendment Act, the plaintiff would have been entitled to an award of $47,619 – as investment of $47,619 at 5 percent will provide a return of $2,381; and $2,381 plus $47,619 is $50,000.

Under the new Act, however, the plaintiff is to be compensated only for his after-tax loss, of $40,000. Thus, if the taxes on interest were ignored, the lump-sum award would be $38,095 – as $38,095 plus 5 percent of $38,095 (= $1,905) is $40,000. However, assume that the interest on the lump sum award will be taxed at 20 percent. In that case, investment of $38,095 at 5 percent would yield a net (after-tax) return of only $1,524 ($1,905 minus 20 percent) and the plaintiff would have only $39,619 with which to replace his $40,000 loss.

The 20 percent tax on investment income has reduced the effective rate of interest by that 20 percent, from 5 percent to 4 percent. (Note that $1,524 is 20 percent less than $1,905, or 80 percent of $1,905.) Thus, if the plaintiff is to have $40,000 available to him one year from now, more than $38,095 will have to be invested today. In this case, that amount will be $38,462 – as $38,462 plus 4 percent of $38,462 (= $1,538) is $40,000. The difference between $38,462 and $38,095 is called the income tax gross-up. NOTE: The gross-up equals the income tax that must now be paid on the interest income that derives from investment of the lump-sum award.

2.2 The magnitude of the tax gross-up: Note that in my simple example, the tax gross-up was very small relative to the size of the lump sum award. This is because there was only one year of losses and, hence, the lump-sum award, (on which interest was to be calculated), was small relative to the size of the annual loss. In cases in which losses are expected to continue for longer time periods, however, both the lump-sum award and the interest earned on investment of that award will be larger relative to the size of the annual payments. In such cases, the gross-up will become a much larger percentage of the award.

For example, assume again that it has been determined that the plaintiff has lost $50,000 per year before taxes, that taxes on that income would have been $10,000 per year, and that the interest rate is 5 percent. Assume also that the loss is expected to continue for 40 years and that the lump-sum award required to replace this stream, before addition of the gross-up, would have been $500,000. If that amount is invested at 5 percent, $25,000 in interest will be generated in the first year and, at a tax rate of 20 percent, the plaintiff will be required to pay $5,000 in taxes. That $5,000, and comparable (but declining) amounts calculated in all 40 of the future years of the loss, will have to be added to the award to ensure that the plaintiff can replace his/her after-tax losses. These “additions” constitute the gross-up.

In many cases, the addition of the gross-up will increase the award by as much as half of the reduction that resulted from the omission of income taxes. For example, if the lump sum, without the gross-up, has been reduced by 20 percent, the gross-up will often add as much as 10 percent back to the award.

It is interesting to ask whether it is possible that the award with the gross-up could be higher than the award that would have resulted from application of the “old” rules, in which income taxes were ignored. The answer is that it is highly unlikely that this will occur. In the example above, the effect of the Insurance Amendment Act was to reduce the plaintiff’s annual claim by $10,000, from $50,000 to $40,000, due to the deduction of 20 percent income taxes. Before the gross-up calculation could return the lump-sum award to the level it would have had prior to the Act, the taxes on investment income – the amount to be added for the gross-up – would have to equal that $10,000. In my example, that would require that investment income be $50,000 per year as, at a tax rate of 20 percent, that would generate $10,000 worth of taxes. (For example, if the lump sum was $1,000,000 and the interest rate was 5 percent, $50,000 investment income would be generated each year.)

That is, before the tax gross-up calculation would “add back” the income tax that had been deducted as a result of the Insurance Amendment Act, (in this case, $10,000 per year), the interest income in each year would have to equal the loss of before-tax income in that year. In my example, the annual before-tax income was $50,000, on which taxes would be $10,000. In order for the investment of the lump-sum award to create $10,000 in taxes on investment income, (which is the amount to be added for the gross-up), at the same 20 percent tax rate, it would have to generate $50,000 in such income. (Again, at a 5 percent interest rate, the lump-sum would have to be $1,000,000.)

But assume that investment of the lump sum did generate $50,000 investment income. That would exactly equal the amount required to pay for both the tax on that income ($10,000) and the compensation required for the plaintiff’s loss of net income ($40,000). That is, after deduction of the two payments from the interest income, the lump-sum would be left intact. But that cannot be correct. It is clearly the intention of the court that the lump sum award be drawn down each year, to help pay for the annual losses, until there is nothing left at the end of the period of the loss. That can only occur if the investment (interest) income in each year is less than the payments for taxes and the plaintiff’s loss. And that implies that the taxes on the investment income (the gross-up) will be less than the taxes on (gross) employment income. In short, in all but very exceptional cases, the gross-up will not be sufficient to return the lump-sum to the level that would have been awarded in the absence of the Insurance Amendment Act.

3. Unanswered Questions

With respect to the income tax issue, the primary question that will have to be answered by the courts is whether a tax gross-up will be allowed. Some lesser questions may also be raised:

3.1 Collateral benefits: The Insurance Amendment Act requires that many collateral benefits be deducted from the plaintiff’s claim. It is not clear whether the plaintiff will be able to include the interest earned on the investment of such benefits in the calculation of the tax gross-up.

3.2 “Add backs”: Self-employed individuals are often able to write off personal expenses as business expenses for the purpose of calculating taxable income. For example, business owners often claim that a greater portion of their vehicle, telephone, and mortgage expenses are for business use than is actually the case. Commonly, in personal injury claims, the “personal” portions of these expenses are “added-back” to reported income in order to obtain a measure of “true” income.

How should income taxes be calculated on this “add back?” Assume, for example, that the plaintiff had been reporting earnings of $30,000 per year, on which she had been paying income taxes of $4,000. Assume also, however, that this individual had benefited personally from $5,000 worth of business expenses per year. When this amount is added back to obtain the “true” measure of income, $35,000, should the income tax calculation be based on that ($35,000) figure, even though the plaintiff had been paying taxes on only $30,000? Or should the court recognise that, in the absence of the accident, the plaintiff would have received $31,000 (= $30,000 reported income – $4,000 income tax + $5,000 “business” expenses) worth of benefits (after tax) from her employment?

3.3 Replacement cost: It is not clear how the Insurance Amendment Act will affect the determination of damages when damages are measured using the “replacement worker” method.

In many cases involving self-employed individuals it is unclear (a) what their true income would have been if they had not been injured; nor (b) what their income will be now that they have been injured. It is often possible to determine, however, how much it would cost to hire a “replacement worker” whose input would return the plaintiff’s business to its pre-injury level of profitability.

Assume, for example, that the plaintiff’s income would have been $50,000 per year if she had not been injured and that it will be $20,000 per year now that she has been injured, but that neither figure can be calculated with any degree of certainty. Assume, however, that it is known that if the plaintiff was to hire an assistant for $20,000 per year, the firm would be as profitable as it would have been if the plaintiff had not been injured. In that case, it is argued, if the plaintiff was paid $20,000 per year, she would be put back in the position she would have been in had she not been injured.

But notice, if the plaintiff had not been injured, her business would have earned a profit of $50,000 per year, on which she would have paid income taxes. With the hiring of the replacement worker, the business again makes a profit of $50,000 before payment of $20,000 to the replacement worker. But, after the replacement worker has been paid, the plaintiff’s business will show only a $30,000 profit; and it is on that number that taxes will be calculated. Thus, if the plaintiff is awarded $20,000 per year, with which to compensate the replacement worker, her net income “with injury” will be: $50,000 (= $20,000 plus $30,000) minus the taxes on $30,000. This is greater than her net income before injury, which was $50,000 minus the taxes on $50,000.

It is not clear how the court will wish to deal with this anomaly, if at all. Note that any attempt to calculate the tax implications of using the replacement worker method will require that estimates be made of both the plaintiff’s with- and without-income streams. Yet it was to avoid having to make those estimates that the replacement worker approach was devised.

4. Impact of Insurance Amendment Act

The Insurance Amendment Act will reduce damage awards by the greatest amount in the following situations:

  • Those in which the plaintiff had been earning a relatively high income and, therefore, had been paying relatively high income taxes.
  • Those in which the plaintiff’s injuries are expected to continue for a relatively long period of time, as the effect of compensating for only after-tax income will be compounded over the duration of the loss – and as the tax gross-up will not fully offset the reduction for taxes.
  • Those in which the plaintiff is not self-employed. Self-employed individuals are able to write off personal expenses against their business income. Assume that it has been determined that those expenses amount to $5,000 per year. Typically, under the current system, that $5,000 will be “added back” to reported income in order to obtain a “true” measure of income. However, the individual would have had to earn more than $5,000 in order to generate enough income to purchase $5,000 worth of goods if he/she had not been self-employed (because income taxes would have been payable on any such income). Hence, the current practice actually compensates the plaintiff only for his/her loss of after-tax income. As that is what will be required under the Insurance Amendment Act, such plaintiffs will be in the same position under this Act as they were previously.
  • Individuals who have a cost of care claim. The income tax gross-up on a cost of care claim will be higher, the greater is the award for loss of earnings. (The higher is the award for loss of earnings, the greater is the interest that will be earned on investment of that award and, therefore, the higher will be the income tax bracket in which other sources of income – for example, interest on the cost of care award – will be placed.) As the Insurance Amendment Act reduces awards for loss of earnings, it will also reduce awards for cost of care.

5. Conclusion

It is my expectation that Section 626.1(2)(a) of the Insurance Amendment Act will not introduce any significant legal principles that have not already been analysed carefully with respect to fatal accident and cost of care claims. The primary impacts of the amendments are (a) more time and effort will now have to be expended in the calculation of personal injury damages (particularly when a gross-up is required); and (b) personal injury damage awards will now be approximately 15 to 25 percent lower than they were previously.

Footnotes:

* This article is based on presentations Dr. Bruce gave to ACTLA seminars in Calgary and Edmonton on June 21 and 23, 2004. He thanks the participants at those seminars for the excellent feedback that helped him to revise his paper. [back to text of article]

leaf

Christopher Bruce is the President of Economica and a Professor of Economics at the University of Calgary. He is also the author of Assessment of Personal Injury Damages (Butterworths, 2004).

How are Automobile Insurance Premiums Determined?

by Christopher Bruce

Although automobile insurance rates seem to be in the news constantly, there is often confusion in the media about the process by which premiums are determined. The purpose of this article is to provide a brief introduction to that process. Three topics will be discussed: actuarial rating, rating classes, and experience rating.

1. Actuarial Rating

In Alberta – and all jurisdictions with private insurance – automobile insurance premiums are established through a technique that is generally referred to as “actuarial rating.” Fundamentally, under this system the premium the driver pays is equal to the cost that the insurance company expects the driver will impose upon it. If, on average, insuring a driver will cost the insurer $1,000 per year, the premium it will charge will equal $1,000 (plus an allowance for the company’s profit margin).

Assume, for example, that an insurance company has 10,000 customers; that there is a 10 percent chance that each driver will have an accident that results in an insurance claim each year; and that the average claim is $7,000. On average, therefore, 1,000 customers will make a claim each year, imposing a total cost of $7,000,000 on the insurer. Spread across the company’s 10,000 customers, therefore, the cost of claims, per customer, is $700.

In addition, the insurer will have to pay for its own costs of administration and will have to collect enough money to provide it with at least the minimum amount of profit to keep its shareholders satisfied. Assume that administrative costs amount to $250 per customer per year and that the minimum “acceptable” profit level can be represented as $50 per customer per year.

In this case, the insurer will have to collect at least $1,000 per year from each of its clients – $700 to cover the average cost of accident claims, $250 to cover administrative costs, and $50 for profit. The theory of actuarial rating predicts that this insurance company will set its premiums equal to that $1,000 figure. The “proof” of the theory’s prediction is as follows:

First, imagine that the company was to set a premium that was higher than $1,000, say, $1,050. Now, the company’s expected profit would be $100 per customer (= $1,050 – $700 – $250), twice the $50 figure that insurance companies require in order to remain in business. A second insurer would see the opportunity to make substantial profits by offering to insure the first company’s clients for less than $1,050, say $1,025. At this rate, its profits of $75 per customer would still be higher than the $50 that shareholders demand. But this would attract additional companies who would be willing to offer an even lower rate. As long as profit exceeds the minimum necessary to attract investors – that is, as long as the premiums charged exceeded $1,000, new firms would continue to enter the market, driving the premium down. In the long-run, the premium rate could not remain above the cost of insurance plus the minimum profit level.

Second, imagine that the insurer was to set its premium below $1,000, say at $900. It would soon discover that the costs of insurance exceeded the premiums that were being collected and it would be forced either to raise its premiums or to go out of business. In either event, premiums would rise until they at least equaled insurers’ costs (plus the minimum profit level).

In short, as long as there is competition in the insurance market – that is, as long as firms are able to compete for the business of their rivals; and firms do not collude to prevent such competition – the premium level will always tend towards the cost of insurance plus a minimal profit level. When premiums are set in this way, they are called “actuarially fair.”

2. Rating “Classes”

In the preceding discussion, I assumed that each client had the same probability of making a claim – 10 percent per year. In reality, of course, some customers have a higher claims probability than others. The theory of actuarial rating predicts that insurers will attempt to identify different “classes” of customers, according to those customers’ claims probabilities, and will charge a premium to each group that is a function of its accident risk.

Assume, for example, that the insurance company discussed above realizes that 2,000 of its 10,000 customers have a higher-than-average probability of making an insurance claim, say 20 percent per year. If it is still assumed that the average probability across all 10,000 customers is 10 percent, that implies that the probability that each of the company’s remaining 8,000 customers will make a claim is 7.5 percent. That is, when the 2,000 high-risk customers each have an accident probability of 20 percent and the 8,000 low-risk customers have an accident probability of 7.5 percent, the average probability of an accident across the two groups together is 10 percent. Thus, the expected number of claims is still 1,000 per year – 400 (= 0.20 × 2,000) by the high-risk group and 600 (= 0.075 × 8,000) by the low-risk group.

If the company continues to charge each of its customers $1,000 per year, it will still make an average profit of $50 per customer. (Because its customers have the same number of accidents and pay the same premiums, the same amount is left over for profit). However, if another company notices what is happening, it will realize that it could make a higher profit than average by attracting away some of the first company’s low-risk drivers.

For example, if the second insurer was able to attract 1,000 customers by charging $900 to the low-risk group, it would find that, on average, 75 of those customers (= 0.075 × 1,000) would have accidents. At an average cost of $7,000 per accident, total accident costs would be $525,000, or $525 per client. Assuming that administrative costs remained at $250, this company’s total costs per client would be $775, leaving a $125 profit from the $900 premium.

Soon, other insurance companies would recognize this profit-making opportunity and they would also offer reduced premiums to the low-risk group. By the theory of actuarial rating, the equilibrium premium for drivers in that group would eventually settle at $825 – the $775 cost per driver plus $50 for profit.

At the same time, as low-risk drivers were being attracted away from the first company, that company would find itself with a higher and higher percentage of drivers from the high-risk group. Assume that, ultimately, all of its clients came from that group. If each of those drivers had a 20 percent probability of making a claim and the average claim cost $7,000, then the average value of claims per driver would be $1,400. When $250 is added to this figure for administrative costs and $50 for profit, the firm would have to charge a premium of $1,700 to each of these drivers to remain in business.

But, high-risk drivers have no incentive to reveal to insurers that they have high probabilities of making claims; and low-risk drivers may find it difficult to signal credibly that they are members of the low probability group. (If insurance companies offer low premiums to those in the low-risk group, it will be in every driver’s interest to claim to belong to that group.)

Hence, insurance companies have looked for ways to construct “classes” of drivers based on characteristics that can be observed readily. There are two types of such characteristics – those over which drivers have little or no control, like age, sex, and (to a lesser extent) area of residence; and those over which they have a significant amount of control, like number of “fault” accidents and number of moving violations.

Age and Sex

It is well known that young males – and, to a lesser extent, young females – have a higher probability of making claims against their insurers than do older drivers. In this sense, young males are similar to the high-risk group discussed in the preceding section.

For this reason, in a competitive market, insurers will be forced to charge higher premiums to young males than to other groups. An insurance company that averaged all drivers together when setting its premiums (for example, setting a single premium of $1,000 in the example above) would soon lose all of its low-risk drivers to other firms that offered those drivers premiums that were related to their expected costs ($825 in the preceding example).

Furthermore, even though some young males are low-risk drivers, they will be charged the high premiums associated with their group. The reason is that, from the insurance company’s perspective, all young males look alike. As long as they drive the same kinds of cars, have the same driving records, etc, insurers will be unable to determine which young males are low risk and which are high.

In a competitive insurance market, there is no way around this issue. Any insurance company that offered premiums that were less than its expected costs of covering young males would find, first, that it would attract a very large percentage of young male drivers and, second, that it would, on average, lose money on those drivers. It would soon be forced to change its policy or be driven out of business.

Driving Experience

A second way of classifying drivers into low-risk and high-risk groups is to observe their driving behaviours. For statistical reasons, it is known that those who have had accidents in the current year have a higher than average probability of having accidents in the next year than do those who did not have accidents in the current year.

Assume again that there are two groups of drivers – 2,000 high-risk drivers, who have a 20 percent probability of making a claim in any given year, and 8,000 low-risk drivers, who have a 7.5 percent probability of making a claim. Assume also that the insurance company is unable to determine, on the basis of characteristics such as age and sex, which drivers belong in each category. In that case, the average probability of an accident across the two groups is 10 percent and, in the first year, the actuarial insurance premium will be $1,000.

During the first year, however, 400 of the high-risk drivers and 600 of the low-risk drivers will have accidents. This means that, among the group “drivers who had an accident in year 1,” 400, or 40 percent of the group, have a 20 percent chance of having an accident in year 2 and 600, (60 percent), have a 7.5 percent chance. On average, the drivers in this group have a 12.5 percent chance of having an accident in year 2. Their actuarial premium, (the premium that covers their expected costs plus profit margin), will be $1,175.

The remaining group, “drivers who did not have an accident in year 1,” will be composed of 1,600 drivers from the high-risk group and 7,400 from the low-risk group. Their average accident risk in year 2 will be approximately 9.72 percent and their actuarial premium will be approximately $980.

What is seen here is that the reason there is a premium differential between drivers who have had accidents and those who have not is not because insurers are trying to “recover the payments” they have had to make on behalf of clients who had accidents. Rather, because the group “those who have had accidents” has a disproportionate number of high-risk drivers (because they are the most likely to enter this group), its expected claims costs must be above average – meaning that its premiums will be proportionately higher also.

This means that the premium differential between those who have had accidents and those who have not will increase as the size of the high-risk group increases (thereby increasing their representation in the “have had an accident” group) and as the risk differential between low- and high-risk drivers increases.

3. Experience Rating

Automobile insurance is designed to protect the purchaser from catastrophic loss. The consumer pays an annual premium in return for a promise from the insurer that the latter will pay for any losses incurred by the former.

But insurance also has a second, unintended effect – it reduces the incentive for drivers to avoid accidents. In the absence of automobile insurance, drivers would have to bear the full financial impact of any negligent behaviour – under the assumptions used in the preceding section that would be $7,000 for each accident. This threat could be expected to induce them to take precautions against such behaviour.

In the presence of automobile insurance, however, the financial impact of negligent behaviour is the difference between the premium charged to drivers who have had accidents and those who have not. In the preceding section, it was shown that this amount could be quite small – less than $200 under the plausible assumptions employed there. This significant reduction in financial risk (relative to the no-insurance situation) can be expected to reduce substantially the incentive to avoid negligent behaviour.

In response, many commentators have suggested that the current actuarial rating system should be replaced by one based on experience rating – that is, a system in which premiums are tied closely to occurrences of driver negligence. For example, insurance companies might be required to ensure that the premiums charged to drivers who had had accidents or serious moving violations were at least double those charged to drivers who had “clean” driving records.

Note that experience rating cannot arise independently in a market in which a large number of firms compete for customers. As was shown in Section 1, above, competition forces firms to charge premiums that are based on actuarial rating. Experience rating can only arise in markets in which there is no competition – such as in provinces like British Columbia and Saskatchewan in which the government has a monopoly – or in jurisdictions in which the government establishes legislation to force private insurers to use that rating system.

Among the legislative changes that were contained in Alberta’s recent Bill 53, (see www.autoinsurance.gov.ab.ca/calculate.html), is a proposal to impose a version of experience rating. Although binding regulations have not been announced yet, the current proposal would require that insurers increase premiums by as much as 50 percent in the year following a single “at fault” claim and by an additional 30 to 40 percent in each subsequent year for six years or more; (that is, by as much as 250 percent when added across the six years following a single claim). The proposed system would also require that insurers increase premiums by 200 percent in each of the two years following a criminal code violation – such as impaired driving or criminal negligence causing death.

Economic theory predicts that experience rating systems – such as the one proposed by the Alberta government – will produce substantial increases in the levels of precautions taken by drivers – and corresponding substantial decreases in the number of accidents. It will be interesting to observe (i) whether the Alberta government will have the political willpower to force such a restrictive rating system on an unwilling and politically powerful insurance industry; and (ii) if it does so, whether such a system will yield the anticipated benefits.

leaf

Christopher Bruce is the President of Economica and a Professor of Economics at the University of Calgary. He is also the author of Assessment of Personal Injury Damages (Butterworths, 2004).

Experience-Rating of Automobile Insurance: A Good Idea that Won’t Work

by Christopher Bruce

This article first appeared on page A21 of the October 16, 2003 Calgary Herald, and then in the summer 2003 issue of the Expert Witness.

Imagine you have two drivers who drive the same kind of car, live in the same city, and have the same driving record over, say, the last three years. Doesn’t it make sense that they should pay the same automobile insurance premiums?

Apparently, it made sense to the provincial government’s Automobile Insurance Reform Implementation Team. Yesterday, they recommended legislation that will require automobile insurance companies to use “experience rating.”

In a nutshell, experience rating refers to a system in which the only factor that determines your premiums is your driving record. All drivers who have no “experience” of accidents, speeding violations, drunk driving charges, etc. pay the same, relatively low base premium. Then, as they experience one or more of these events, their premiums rise accordingly – and, as they have additional years in which they do not experience these events, their premiums decline.

Experience rating has two highly desirable characteristics. First, the individual driver has complete control over his or her premiums. If you drive cautiously, avoiding accidents and driving violations, your premiums will decline to the lowest available rate.

Most importantly, your rate will not be higher than anyone else’s just because you happen to belong to a group, like young males, that has a relatively high accident rate.

Second, it has been shown consistently that when insurance premiums are related to experience, accident rates fall. When individuals know that they can reduce their premiums significantly by driving more carefully, they do so. And, of course, if the number of accidents decreases, so will insurance premiums.

It seems like experience rating is a win-win proposition. If so, then why hasn’t it been introduced before? The simple answer is that it results in a situation in which insurers know they will make substantial profits on some classes of customers and lose money on others. Thus, it gives them a strong incentive to refuse to insure the money-losing group.

In the scheme proposed by the government, that group will be composed primarily of young males.

Insurers will lose money on them because the number of accidents a driver has had in the past is only loosely related to the number that they can be expected to have in the future. What decades of statistics tell us is that a nineteen year-old male with a perfect, three-year driving record is more likely to have an accident in the next year than is a forty-year old male with the same driving record.

And a nineteen year-old who had an accident last year is more likely to have an accident next year than is a forty-year old with the same experience.

This means that insurers will expect to pay out more claims to nineteen year-old drivers than to forty year-old drivers.

Assume, for example, that 10 percent of nineteen year-old drivers who have had a clean record for three years will have an accident in the next year; whereas only 5 percent of forty year-olds with a similar record will have an accident next year. If the average accident costs the insurance company $10,000, then it will expect to pay out an average of $1,000 for each nineteen year-old and $500 for each forty year-old.

If the government forces insurers to charge the two groups the same premium, they will have to charge something between $500 and $1,000 just to cover their expected claims costs. For example, if the two groups were the same size, the premium would be $750 (the average across the two).

But this means that they will expect to make a $250 profit on the average driver in the older group and a $250 loss on the average driver in the younger group.

As insurance companies are out to make profits, we can expect that they will respond by doing their best to attract older drivers – and to turn away younger drivers.

The stakes are high. Those companies that find themselves with a relatively high percentage of young drivers will lose money and will soon be forced out of the market. Companies will use every loophole at their disposal to attract as many drivers in the older age groups as possible.

Advertising will be focused on older drivers – ads will appear primarily in magazines that appeal to middle-aged consumers, for example, and music in TV ads will be taken from the 1960s. Agents will be instructed to make it difficult for younger drivers to obtain insurance. And incentives, like toaster ovens for new clients, will be offered that will appeal primarily to older drivers.

The result is that the government will have to introduce ever-stricter regulations, to ensure that all drivers are able to obtain insurance. It will be interesting to see whether this degree of interference in the private sector is something that a market oriented government is willing to countenance.

leaf

Christopher Bruce is the President of Economica and a Professor of Economics at the University of Calgary. He is also the author of Assessment of Personal Injury Damages (Butterworths, 2004).

No-Fault Automobile Insurance

by Christopher Bruce & Angela Tu Weissenberger

This article was originally published in the Autumn 2001 issue of the Expert Witness.

In a recent paper, Norma Nielson and Anne Kleffner, of the Faculty of Management, University of Calgary, recommended that Alberta adopt a no-fault automobile insurance system.

The purpose of this article is to provide a response to Nielson and Kleffner. The article is divided into five sections, in which we discuss:

  • the deterrent effect of tort rules,
  • the high cost of no-fault insurance systems,
  • arguments concerning the role of lawyers,
  • evidence concerning the costs of bodily injury claims, and
  • evidence concerning insurance fraud.

The Deterrent Effect

Although Nielson and Kleffner argue that one of the functions of an ideal “…system for compensating accident victims [is to] … provide individuals with incentives to behave in a way that minimizes accidents and the resulting injuries…” they choose to ignore this function in their paper. As the majority of recent empirical studies have shown that accident rates are higher in no-fault regimes than in tort-based regimes, their failure to address this issue seriously biases their conclusions.

For example, recent evidence suggests that fatal accident rates are between 5 and 10 percent higher in no-fault jurisdictions than in tort-based jurisdictions. This means that, at the 1998 highway fatality level of 429, the introduction of no-fault insurance would result in the deaths of between 21 and 42 Albertans per year.

We have identified five studies published in the 1990s that offer rigorous analyses of the effects of no-fault insurance on automobile accident rates. These studies argue that no-fault may reduce the deterrent effect of insurance in two ways.

First, insurers have historically provided a deterrent to accident-causing behaviour by increasing drivers’ insurance premiums when they have been found to be at fault for accidents. Under no-fault insurance systems, however, fault is not measured. As a result, insurance companies find it more difficult to tie premiums to driving behaviour and the deterrent effect is weakened.

Second, in tort systems, the party that has been found to have “caused” an accident is required to bear most of his or her own costs. The threat of having to bear these costs is presumed to act as a deterrent to accident-causing behaviour. In no-fault systems, on the other hand, the parties are compensated fully for all of their costs, regardless of fault. Thus, the threat of having to bear those costs is removed and the deterrent effect of insurance is once again weakened.

A concern of all of the studies identified by us is that, because the incentive to report accidents may vary among insurance regimes, changes in the reported number of accidents may not reflect true changes in the underlying accident rate. Accordingly, three of the studies restricted their analyses to fatal accident rates, as these rates are not subject to reporting error. All three studies found that the incidence of fatal accidents increased following the introduction of no-fault.

In the first of these, Devlin (1991) found that the number of fatal accidents increased by 9.62 percent after the introduction of no-fault in Quebec.

Similarly, Cummins et. al. (1999) found that fatal accident rates were between 5.5 and 9.9 percent higher in US states that had no-fault insurance than in those that permitted full access to the tort system.

And Sloan et. al. (1994) estimated that for every 10 percent of drivers who were denied access to the tort system (by no-fault insurance), the fatal accident rate rose by 7.2 percent. (For example, a move from a system that permitted full access to tort law to one that allowed access to only 80 percent of drivers would increase the fatal accident rate by 14.4 percent.)

A second approach was adopted by Cummins and Weiss (1991). They argued that, as no-fault insurance systems did not alter the legal rules involving property damage claims, there should be no direct effect of no-fault on those claims. However, if no-fault affected driving behaviour through changes to the rules concerning personal injury claims, an indirect effect on property claims would be expected. That is, if no-fault reduced the incentive to take precautions to avoid personal injury, that reduction should increase both personal injury and property damage claims.

Accordingly, Cummins and Weiss compared property claims between tort and no-fault states. Their finding that property claims were 4 percent higher in no-fault states led them to conclude that the introduction of no-fault had reduced the deterrent effect of automobile insurance and increased the number of automobile accidents.

Finally, Devlin (1997) investigated the effect of no-fault insurance on the severity of automobile accidents in the United States. She found that the probability of sustaining a serious accident was significantly higher, and the probability of sustaining a minor accident significantly lower, in no-fault states than in tort states. That is, even if the overall accident rate was the same between two states, the average severity of accidents would be higher in the no-fault state than in the tort state.

These studies show convincingly that no-fault insurance reduces the incentive for drivers to take precautions. The result is that, under no-fault insurance, there is an increase in the number of fatalities, in the overall number of automobile accidents, and in the average severity of accidents. Although these effects were ignored by Nielson and Kleffner, it is clear that they must be taken into account when changes to the insurance system are being considered.

The High Cost of No-Fault Insurance

Empirical analyses of no-fault insurance jurisdictions indicate that there are virtually no cost savings to be obtained by switching from tort law to no-fault insurance. Indeed, experience in no-fault states and jurisdictions around the world indicate that the system is not effective in reducing the overall cost of accident compensation.

Our review of the research indicates that there has been no realization of lower insurance premiums as a direct result of the adoption of no-fault insurance.

  • According to the National Association of Insurance Commissioners data (1988-1998), liability premiums in the US no-fault states are amongst the highest in the country. New Jersey (a no-fault state) has the highest average liability premiums and exceeds the national average premium by 71%.
  • In their analysis and evaluation of no-fault Laws, the Foundation for Taxpayers and Consumer Rights (1997) point out:
    • Though many states have experimented with various forms of no-fault plans, few have been shown to obtain reduced insurance premiums.
    • No-fault states have the highest average automobile insurance premiums.
    • Between 1989 and 1995 premiums in mandatory no-fault states rose nearly 25 percent more than in no-fault states.
    • Premiums fell immediately in states that repealed no-fault insurance.
  • The Insurance Bureau of Canada (1991) reports that during the first year following the implementation of the no-fault scheme in Ontario, insurance industry profits increased by $750,000,000 with no appreciable decrease in premiums.
  • Nielson and Kleffner (2001) report that no-fault has not reduced auto insurance costs, but rather, costs are higher due to the very generous benefits paid out (e.g. in Quebec and Manitoba there is no time or amount limit on medical payment benefits). This further raises the question of how a no-fault system implemented in Alberta can realize significant cost savings.
  • The few jurisdictions that cited savings due to no-fault attribute the reduction in costs to the elimination of non-economic loss award for persons whose injuries do not exceed a prescribed threshold (Carroll and Kakalik, 1991). Regardless of the threshold level, non-economic loss is real. Eliminating or restricting individuals’ compensation for losses concerning pain and suffering and mental anguish means denying them the funds necessary for physiotherapy, psychological treatment etc. which are critical to reparation for non-economic loss. This is at odds with the very intent of no-fault insurance, which is to compensate an individual adequately for losses arising from the accident regardless of fault.
  • Nielson and Kleffner claim that no-fault plans match compensation more closely with economic loss by increasing the fraction of economic loss that is compensated and by reducing the amount of compensation paid people in excess of their economic loss. In other words, they recommend reducing victim compensation in order to save money.

Attorney Involvement

Nielson and Kleffner suggest that attorney involvement in claims is a key contributor to the escalation of bodily injury costs. Their conclusions are based on a study conducted by the Insurance Research Council that examined medical utilization in cases that did and did not involve attorney representation. That study concluded that represented claimants were more likely than non-represented to seek treatment from medical practitioners and that the former had a higher average number of visits to practitioners than did the latter.

Nevertheless, the authors suggested that claimants represented by lawyers were no better off than those who were not represented. In particular, despite the fact that average gross compensation to the represented claimants was higher than that to claimants not represented; the former netted less for their injuries than did the latter. The difference is explained by the fact that represented claimants incurred higher costs – including legal fees and court costs – than did non-represented claimants.

The All-Industry Research Advisory Council (1988) shows households that hired attorneys had longer settlement times for injury claims than those who did not. Households that reported large economic loss were more likely to have hired an attorney. Further, although 80 percent of households that did not hire lawyers were satisfied with the overall amount that they received from all benefit sources, only 58 percent of claimants who did hire attorneys were satisfied.

These studies do not support Nielson and Kleffner’s claim that lawyers provide no valuable function in the claims settlement process.

  • The studies ignore the fact that cases requiring legal representation are usually more complex than those that do not require representation. Individuals who choose not to hire lawyers usually do so because they have relatively simple cases. Nielson and Kleffner have the causal relationship reversed. It is not that lawyers “cause” cases to take longer to settle; it is that plaintiffs seek legal representation when they recognise that they have complex cases.
  • Households are not forced to use lawyers. The fact that many choose to do so indicates that they believe that lawyers provide a valuable service. Hiring a lawyer to assist in the pursuit of a damage claim is analogous to hiring a realtor to help in the sale of a property. Individuals have the option of selling their property privately. The fact that many people choose to hire realtors provides strong evidence that people perceive value in doing so – otherwise they would not do it. Similarly, purported “evidence” that claimants obtain little or no value from the hiring of lawyers must be set against the undeniable evidence that most claimants do hire lawyers.
  • Satisfaction and payout of benefits cannot be compared on a consistent basis. Such comparisons assume that the severity and complexity of injuries is the same. It also assumes that all people hire lawyers for the same reasons.

Nielson and Kleffner conclude that since attorney involvement in settling claims “results” in lower net settlement amounts and longer time to settlement, it would appear that reducing attorney involvement would be one way to increase satisfaction of claimants.

But there is no empirical evidence to show that reducing attorney involvement would increase satisfaction of claimants. On the contrary any restriction on such involvement would be expected to lead to more dissatisfaction as the claimant no longer has a choice or a place to turn for representation should he or she not agree with the claim offered by the insurer.

Increasing Proportion of Accidents Producing Injury Claims

According to Nielson and Kleffner, in Alberta the number of bodily injury claims has been rising much faster than property damage claims. During 1986-1999: the number of vehicles insured increased 24 percent, the number of bodily injury claims increased 157 percent, property damage claims frequency decreased from 4.94 to 3.04, and the number of property damage claims decreased 22 percent from 59,353 to 45,996. Claims cost for bodily injury losses (cost per insured vehicle) increased 200 percent while the consumer price index increased only 43 percent.

Nielson and Kleffner attribute the dramatic rise in bodily injury costs to a purported change in the claiming behaviour of motorists and passengers. They suggest that many of these claims are in fact not legitimate. However, the statistics that they report do not allow them to draw this conclusion.

  • The argument assumes implicitly that all drivers are identical and suffer exactly equivalent injuries in any accident. It ignores the fact that increased costs to treat injuries could be attributed to an increase in severity of injuries due to more crowded road conditions, increased number of passengers per vehicle, and/or the requirement to compensate for rising income losses.
  • That bodily injury claims costs increased more rapidly than the consumer price index does not provide any evidence of fraud or increased litigiousness. First, over the period investigated by Nielson and Kleffner (1986-1999) per capita medical costs rose by more than 75 percent in Canada (almost double the rate of inflation over that period). Second, wages and salaries also increased more rapidly than inflation, thereby increasing claims costs for lost earnings. Third, and most importantly, the Supreme Court rulings in the “trilogy” cases in 1978 led to a dramatic change in the way that damages were assessed in Canada. These changes allowed plaintiffs to obtain damages that much more closely reflected the losses they had incurred than had been possible previously. The result was that, over the 1980s, bodily injury damages rose while the lower courts absorbed and applied the Supreme Court’s new rules.
  • Bodily injuries can arise independently of property damage. While there might be fewer fender benders, the increase in bodily injury claims and costs may be attributed to an increased severity of automobile accidents and increased number of passengers per vehicle.
  • Furthermore, with improvements in the quality of automobile bodies, there may have been an increase in the number of accidents that do not cause significant property damage yet result in serious personal injuries (particularly to the neck and back).

Changes in Claims Behavior

Nielson and Kleffner cite two studies that purport to show that no-fault insurance reduces the propensity to exaggerate claims for personal injuries – studies by Cassidy et. al. (2000) and by Carroll et. al. (1995). Both of these studies are so seriously flawed as to be of no value.

Nielson and Kleffner identify the Cassidy study as the most important Canadian research examining the link between claiming behavior and treatment patterns. In this study, funded entirely by Saskatchewan Government Insurance, Cassidy et al examined 7462 whiplash injury claims filed in Saskatchewan in the six months before, and the twelve months after, that province converted from a tort liability to a no-fault system.

They claimed to have found that plaintiffs recovered from their injuries much more quickly under the no-fault system than under tort. The purported evidence for this finding was that insurance files for whiplash claims were “closed” much more quickly under no-fault than under tort. The implication drawn by Cassidy et. al. was that plaintiffs were more likely to exaggerate the extent of their injuries in a tort system, where parties are allowed to obtain compensation for “pain and suffering,” than in a no-fault system where such a claim is usually denied.

There are several flaws with this study:

  • It is clear that the primary reason the whiplash files closed more quickly under no-fault than under tort was that claimants were provided with a forum in which they could appeal the insurance company’s rulings in the latter but were denied that opportunity in the former. Under Saskatchewan’s no-fault automobile insurance system, decisions about the claimant’s treatment and compensation are made administratively, by the insurer. Under the previous tort system, the plaintiff had the opportunity to appeal the insurer’s decision to the courts, and often did. It was the removal of the freedom to appeal that resulted in claims being closed more quickly, not a sudden decrease in drivers’ willingness to defraud the insurer.
  • The study did not give conclusive evidence regarding whether people were physically better or worse off as a result of no-fault. All the research was able to show was that claims closed faster under no-fault than under the tort system.
  • The tort claims investigated by the authors were restricted to the period six months prior to the implementation of no-fault. But in the US it has been found that claims filings increase substantially in the six months to a year before no-fault is introduced as claimants expect to be dealt with more fairly in a tort system than under no-fault. As a result, claims experience in the six months prior to the introduction of no-fault cannot be assumed to be representative of all claims under tort.

The second paper cited by Nielson and Kleffner in support of their claim that drivers have been making “excessive” claims against their insurers is Carroll, Abrahamse, and Viana (1995). We have carefully reviewed this paper and conclude that it provides no support for Nielson and Kleffner’s claim.

First, many of the results in the Carroll paper are conditional on the assumption that general (non-pecuniary) damages are highly correlated with damages for economic loss. It is their assertion, for example, that if the loss of income resulting from a broken leg in one accident is twice as large as the loss resulting from the same injury in a second accident, the general damages (damages for “pain and suffering”) in the first will be approximately twice as large as in the second. The result, Carroll et. al. argue, is that individuals have a double incentive to exaggerate the extent of their economic losses.

Nielson and Kleffner imply that this incentive to exaggerate economic losses exists in Canada. It does not, for three reasons.

  • The Supreme Court of Canada has set an absolute limit on the size of general damages, of approximately $260,000. The lower courts have interpreted this limit to imply that general damages on “lesser” injuries (for example, a broken leg) must be proportional to those on the most serious injuries, like quadriplegia (that is, on those eligible for the maximum damages). Thus, general damages for a broken leg cannot exceed a relatively low amount, no matter how large the attendant economic damages might become.
  • General damages in Canada are determined by the physical nature of the injury, not by the level of economic damages that are consequent on the injury.
  • In cases of serious injury (the cases that Nielson and Kleffner argue constitute the bulk of dollar claims in Canada), claims for economic damages are subject to intense scrutiny by phalanxes of lawyers, economists, medical practitioners, vocational consultants, and numerous other expert witnesses in a process that is carefully monitored by both the courts and the insurance industry. The opportunities for exaggeration are severely constrained by both the professionalism of the participants and the adversarial nature of the process.

Second, Carroll et. al. argue that there will be fewer incentives to exaggerate economic damages in states with no-fault insurance if plaintiffs must meet a “verbal” threshold (i.e. must show that their injury is present on a list of eligible injuries) before they can sue under tort than if the plaintiffs must meet a “dollar” threshold (i.e. must show that economic damages exceed a pre-specified level). They conduct two tests of this hypothesis.

First, they calculate the ratio of “soft” injuries (those, such as soft tissue injuries, that are relatively easy to disguise) to “hard” injuries (those, such as broken bones, that are objectively verifiable) in each of the U. S. states. When they find that the two “verbal” threshold states – Michigan and New York – have among the lowest ratios, they “conclude” that their hypothesis has been confirmed. Plaintiffs in the “non-verbal” threshold states are exaggerating their “soft” claims.

This conclusion cannot be supported by the data. It is clear that the reason the ratio of soft to hard injury claims is low in New York and Michigan is that the verbal thresholds in those states exclude most soft injuries from the approved list. Plaintiffs suffering from non-approved injuries are denied the opportunity to make tort claims. Thus, the ratio of soft to hard injury claims is low in the verbal threshold states primarily because plaintiffs have been excluded by administrative fiat, not because claimants refrained from exaggerating the extent of their injuries in the latter.

Furthermore, the second test that is offered by Carroll et. al. is inconclusive. They argue that, because general damages (for “pain and suffering”) are correlated with pecuniary damages (for medical expenses and lost earnings), individuals have an incentive to exaggerate the level of their pecuniary damages. They predict, therefore, that the average level of damages will be higher in tort states than in no-fault states – particularly those no-fault states that require claimants to meet a verbal threshold before general damages can be awarded.

The evidence they provide, however, shows clearly that there is only a tenuous correlation between damages for soft injury claims and the nature of the legal system. Indeed, if the figure on page 18 of their report shows any correlation it is that average damages are higher in verbal threshold states than in tort states.

To conclude, the Carroll study, like the Cassidy study, provides no reliable evidence that injured parties are more likely to exaggerate their claims in a tort system than they are in a no-fault system.

References

All-Industry Research Advisory Council. (1988) Attorney Involvement in Auto Injury Claims, December, 1988. Oak Brook, IL.

Carroll, Stephen, Allan Abrahamse, and Mary Vaiana. (1995). The Costs of Excess Medical Claims for Automobile Personal Injuries. Santa Monica, CA: RAND, Institute for Civil Justice.

Carroll, Stephen J. and James S. Kakalik. (1991). “No-Fault Automobile Insurance: A Policy Perspective.” Santa Monica, CA: RAND, Institute for Civil Justice.

Cassidy, J. David, Linda Carroll, Pierre Cote, Mark Lemstra, Anita Berglund, and Ake Nygren. (2000). “Effect of Eliminating Compensation for Pain and Suffering on the Outcome of Insurance Claims for Whiplash Injuries,” New England Journal of Medicine, 342 (16), 1179-1186.

Cummins, J. David, and Mary Weiss. (1991). “Incentive Effects of No-Fault Automobile Insurance: Evidence from Insurance Claim Data,” in G. Dionne, (ed.) Contributions to Insurance Economics. Norwell, MA: Kluwer Academic Publishers, 445-470.

Cummins, J. David, Mary Weiss, and Richard Phillips. (1999). The Incentive Effects of No Fault Automobile Insurance. Wharton School, University of Pennsylvania. Working Paper 99-38.

Devlin, Rose Anne. (1991). “Liability Versus No-Fault Automobile Insurance Regimes: An Analysis of the Experience in Quebec,” in G. Dionne, (ed.) Contributions to Insurance Economics. Norwell, MA: Kluwer Academic Publishers, 499-520.

Devlin, Rose Anne. (1997). No-Fault Automobile Insurance and Accident Severity: Lessons Still to be Learned, Department of Economics, University of Ottawa. Working Paper 9707.

Foundation for Taxpayers and Consumer Rights. (1997). A Failed Experiment: Analysis and Evaluation of No-Fault Laws.

Insurance Bureau of Canada. (1991). Quarterly Industry Analysis Survey, Fourth Quarter.

National Association of Insurance Commissioners, Research Division. (1988-98). State Average Expenditures and Premiums for Personal Automobile Insurance.

Nielson, Norma and Anne E. Kleffner. (2001). “Recommended Reforms to Alberta’s Auto Insurance System”. Unpublished paper, April 23.

Sloan, Frank, Bridget Reilly, and Christoph Schenzler. (1994). “Tort Liability versus Other Approaches for Deterring Careless Driving,” International Review of Law and Economics 14, 53-71.

leaf

Christopher Bruce is the President of Economica and a Professor of Economics at the University of Calgary. He is also the author of Assessment of Personal Injury Damages (Butterworths, 2004).

Angela Tu Weissenberger is principal of ATW Economics Group Inc. where she is a specialist in strategic market positioning and industry analysis with an emphasis on economics and finance. Prior to founding the ATW Economics Group, she led a team of analysts responsible for the risk assessment of energy companies at one of Canada’s largest financial institutions. Angela holds B.A. in Economics and an M.A. in Economics with a specialization in Law and Economics from the University of Calgary. Her graduate work focused on the deterrent effect of no-fault automobile insurance systems.