The Structure of a Cost of Care Report

by Christopher J. Bruce, Kelly A. Rathje

As economists, we are often asked to calculate the present value of future costs of care. As these calculations are based on the reports of cost of care experts (CCEs), we have become uniquely familiar with the structure and content of those reports.

In this article, we provide a review of the format and contents of cost of care reports, drawn from our experience using those reports as inputs into our own calculations. We anticipate that this review will be of greatest use to:

  1. members of the bar: as a checklist against which to evaluate the cost of care reports that have been provided for them and their opponents;
  2. individuals who have recently begun preparing cost of care reports: to provide them with an understanding of how those reports will be used; and
  3. experienced cost of care experts: as an analysis of some of the complexities that can arise in personal injury actions. For these experts, most of our suggestions will be familiar; but we hope that we raise sufficient questions to make this report of interest to them also.

Incremental Costs

One of the most difficult questions facing the cost of care expert (CCE) is that of distinguishing between those costs that would have arisen had the plaintiff not been injured and those that have arisen as a result of the plaintiff’s injuries. This issue is particularly important when the item required with-accident differs only in quality or type from a similar item that would have been purchased without-accident, for example when the plaintiff now requires a different type of automobile than she would have purchased had she not been injured.

A number of issues arise with respect to incremental costs:

1) When the item required by the plaintiff costs more than the equivalent item for a non-injured person, it is important to be very clear about what is being assumed about the characteristics of the item that would have been purchased by the non-injured person. For example, assume that it has been recommended that a paraplegic purchase a van that costs $45,000 per year. As the incremental cost is the difference between that $45,000 and the cost of the car the plaintiff would have purchased if he had not been injured, it is important that the CCE be able to defend any assumption that has been made about the cost of the latter. Would the plaintiff have owned a Honda that cost $20,000, or a Lexis that cost $50,000? On what basis has that conclusion been reached?

2) Following from the preceding point, it is also important to alert the reader to the possibility that the item that has been recommended by the CCE may be of a different quality than the item the plaintiff would have purchased had she not been injured. Would a $45,000 van, for example, “replace” a $50,000 Lexis? And would the quality of accommodation and food in, say, a nursing home replace the equivalent items in the plaintiff’s own home?

3) An important example of quality differentials arises with respect to the care of injured children. Assume that a child’s injuries are sufficiently severe that the CCE has recommended that professional child care be provided for her – for example, 24-hour attendants. Assume also that the child has a stay-at-home mother; that is, one who would have provided 24-hour care before the child began school. Can it be argued that, as the child would have received 24-hour care in the absence of the accident, the accident has not caused any increment in costs? The answer to this question depends on whether the type and extent of care (i.e. the “quality” of care) that the child now needs exceeds that which would normally have been provided by her parents. For example, during the ten hours that the child normally sleeps, incremental care might be recommended because she will wake more often than normal, or because specialized medical care will be required during those hours. If so, it would be useful if this was specified in the cost of care report. Similar specifications may also be necessary with respect to time that a non-injured child would have spent at school or in day-care.

4) When estimating what the plaintiff would have spent on a category of items if he had not been injured, a distinction must be made between the expenditures that he is currently incurring and those that he would have incurred if he had not been injured. For example, if the accident has reduced the plaintiff’s income, it is quite possible that he will now be living in an apartment with a lower monthly rent than he would have incurred had he not been injured. It is the difference between the rent of the apartment the CCE has recommended (with-accident) and the rent of the apartment he would have lived in (without-accident) that is the incremental cost due to the accident.

5) If the item owned by an injured plaintiff has a longer or shorter life expectancy than the equivalent item owned by a non-injured person, the CCE should identify what that difference is. For example, the van required for a paraplegic might have a five-year use life, whereas the car that the plaintiff would have driven if she had not been injured might have had a ten-year life. In such a case, it would not be appropriate to calculate the incremental cost by deducting the purchase price of the car the plaintiff would have bought from the purchase price of the van, as two vans will have to be purchased for each car.

Variations over Time

The requirements for many items will vary over the plaintiff’s lifetime. It is important to identify when such changes will occur and what their effect will be on annual costs:

1) The plaintiff would have incurred some of the costs of care at various times in his lifetime even if he had not been injured. For example, at age 80, the plaintiff may have hired a housekeeper. Thus, if the CCE had recommended housekeeping services from the date of the accident, for life, the cost that would have been incurred after 80 must be deducted from the recommended expense. In such cases, it would be useful if the CCE was to indicate the age at which the plaintiff would have incurred the stated expense (in the absence of the accident), and what the difference is between the cost of the recommended level of housekeeping and the level that would have been purchased had the accident not occurred.

2) It is important to be clear about variations in expenses over the course of a year – such as due to school holidays and vacations – and over a lifetime – such as because the plaintiff would have started elementary school, entered university, had children, or retired.

3) If the plaintiff will have to undergo surgery in the future, the CCE should indicate how long the recovery period will be and how much the extra costs will be during that period. Also, it will be useful to the economist to know whether the plaintiff will be able to return to work before the end of the recovery period.

Ranges of Estimates

We often find that CCEs provide a range of estimates for the cost of a recommended item. For example, it might be reported that the cost of personal care attendants will vary from $14,500 per year to $21,400. When the CCE wishes to report such a range, we recommend that a reason be provided why a single number would not be appropriate, and the source was of each of the costs in the range be identified. For example, if there is more than one cost, that might be because:

  • the CCE received more than one quote, from more than one provider (and if so, why was the lowest quote not chosen?);
  • there were different costs for different qualities of the product;
  • different costs were appropriate to different potential medical outcomes;
  • costs varied among cities in which the plaintiff might live; etc.

Housekeepers and Personal Care Attendants

The CCE report should clearly specify the sources for the hourly costs of individuals who provide housekeeping services, such as housecleaners, yard workers, and maintenance workers. Otherwise the cost of care report may be subject to criticism from experts, such as economists, who are familiar with data concerning the wage rates of these individuals.

Once it has been determined how many hours are required for each type of personal care attendant (for example, nurses and LPNs), there are two basic approaches to estimating the cost of those individuals. The first of these, the agency approach, is to obtain the cost of hiring an agency that will be responsible for all of the specified activities. The second, the hourly wage approach, is to obtain an hourly wage for each type of attendant and then multiply those wages by the specified hours for each type.

Although the latter approach often appears attractive, in the sense that it yields a lower estimate of costs than does the former, there are many reasons to be cautious about use of this approach. First, unless the plaintiff is capable of handling his/her own affairs, the hourly wage approach often assumes that there is a family member who will work without compensation to hire and supervise attendants. But, even if such individuals are available currently, there is no assurance they will be available over the entire course of the plaintiff’s disability. Furthermore, in those years in which family members are available to assist the plaintiff, the courts will generally allow them to claim for the costs of their time, invalidating the assumption that their time is “free”.

Second, the hourly wage approach may not take into account that substitutes will have to be provided for attendants who are ill, wish to take vacations, or who quit without warning.

Third, allowance has to be made for the possibility that attendants will not provide adequate care. This requires that the family or plaintiff have some expertise in both the investigation of the backgrounds of potential hires and in the provision of supervision of existing employees.

Finally, the hourly wage approach would have to provide an allowance for the hiring of additional personnel when emergencies arose. Whereas most agencies will be able to call on their own nurses, and will have close contacts with doctors, ambulances, and hospitals; the plaintiff and his/her family will generally have no expertise in hiring these experts.

Other Factors

We also make the following recommendations concerning the cost of care report:

1) The report should indicate whether GST is included or excluded in the costs recommended.

2) As some items will be GST-exempt while others will not, it is important to distinguish between the two.

3) Indicate whether the costs identified for a particular item are for a different year than the one in which the report was written. For example, if a report was written in 2015, the costs may have been collected from 2014 price lists, or may have been forecasted for a settlement date in 2016. [We generally assume that a report written in 2015 uses “2015 prices”.]

4) It may be advisable, particularly in contentious cases, to have a physician read the CCE’s report and approve the medical expenses, in writing.

Presentation

In addition to the recommendations we have made above, concerning the content of the cost of care report, we also have a number of (minor) suggestions concerning the format, or presentation, of that report:

1) We appreciate it when the CCE provides a summary table in which the annual cost of each item is clearly set out, along with the number of years each cost is to be repeated. We acknowledge that at times, a unit cost, such as medication costs per unit, plus the number of units required over a specific time period is provided. This is just as useful to us, as from this information we can easily determine an annual cost1.

2) If an expenditure is to be made less often than annually – for example, replacement of a car or wheelchair once every five years – it is not necessary for our purposes that the CCE averages the costs over the life of the item. Provide only the replacement cost and the number of years between replacements.

3) On items like cars, houses, and wheelchairs, the cost of care report should, however, provide the annual costs of repair, maintenance, and operation. For a car, for example, provide estimated costs of repairs, of oil changes, and gasoline and tires.

4) The report should be clear about time ranges. For example, it is confusing to say that an item will cost $600 per year from age 25 to 35 and $450 from age 35 to 45, as that leaves it unclear what the cost will be at age 35. We would recommend, instead, that the report say something like: the item will cost $600 per year from 25 to 35 and $450 per year from 36 to 45.

5) There is no need to “round” numbers up or down as economists use spreadsheets for their calculations.

A Sample Economist’s Report

As the economist’s report is always written after the cost of care expert’s report, we suspect that many CCEs will not have seen very many economist reports. As it may help the CCE to understand what types of information are required for an economist report, and in what format that information should be provided, in the table presented below we provide a sample copy of a cost of care calculation for a hypothetical seven-year old male plaintiff.

In the footnote to the table, we have also provided an example of a typical assumption we would make when a range of replacement times has been provided by the CCE.

The columns in the table have the following interpretations:

Tax creditable expense: “Y” in this column indicates that the item can be claimed as a medical expense for income tax purposes.

Cost including tax: the cost of the item, including all taxes.

Replacement life: This column reports the frequency of expenditure. “0” in this column means that the item is purchased only once (there is no frequency); “1” means that the item is purchased every year; “2” means that it is purchase once every two years, etc. For example, under “Mobility” the “Ankle/foot orthotic (adult)” is to be replaced once every three years; the “Adapted bike,” however, is to be purchased only twice, at ages seven and fourteen.

Starting age: The age at which the item is first to be purchased. As the hypothetical plaintiff is seven years old, most purchases begin at seven. However, it is seen, for example, that many items in this table are not to be incurred until the plaintiff is eighteen.

Ending age: Many of the items are to be purchased only over a portion of the plaintiff’s life. Often, as in this case, the costs are different when the plaintiff is a child than when he/she is an adult, and costs may change again when the plaintiff retires or enters a senior’s facility.

Present value of costs: This is the lump sum that would have to be invested today to provide the plaintiff with sufficient funds to replace the stream of future costs in each row. For example, a “Before/after school, weekend care” expenditure of $56,060.76 per year from age seven to thirteen will cost $309,468. This figure varies according to the annual cost, the duration of the expenditure, the discount rate, and the plaintiff’s life expectancy.

 Multiplier: Assume that the cost of care expert has recommended an expenditure of $1,000 per year for the next ten years, and that the present (lump-sum) value of this cost has been calculated to be $8,300. If that expenditure was to be doubled, to $2,000 per year over the same time span, the present value of the cost would also double, to $16,600. Alternatively, we can represent this by saying that for every $1.00 of annual costs (over this ten-year span), the present value of future costs will be $8.30. Any lump-sum cost can be obtained by multiplying the annual cost by 8.30. The latter figure is called the “multiplier.” It can be used by the court to recalculate the present value of future costs if the court should conclude that the annual costs are different from those recommended by the cost of care expert.

     For example, if the court was to rule that annual before/after school costs were $40,000 (instead of the $56,060.76 reported in the table, the present value would be $40,000 multiplied by the reported multiplier, 5.52, yielding $220,800. [Note: there is a separate multiplier for each starting/ending age combination. Multipliers also differ if a different discount rate or life expectancy is used.]

Sample Cost of Care Calculation for Seven-year-old Plaintiff

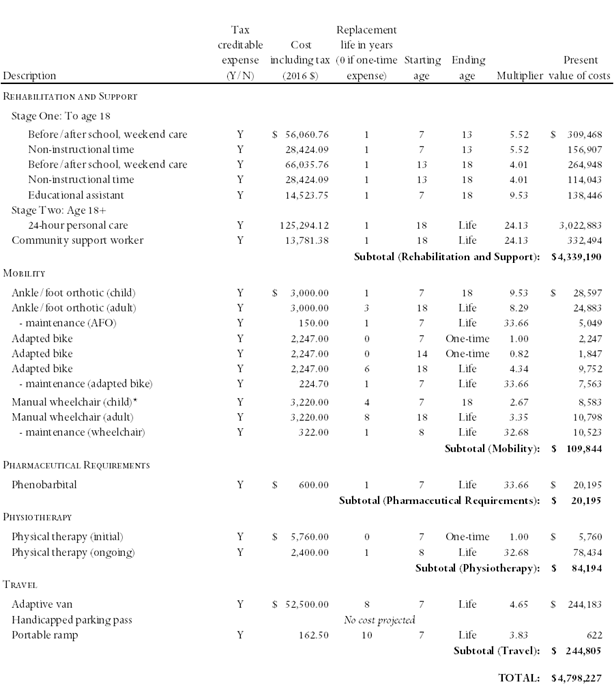
 * The cost of care expert recommended that the wheelchair be replaced approximately every three to five years. It was also indicated that once the child’s chair had reached its maximum capacity, it would have to be replaced with an adult chair. For the purposes of our calculations, we have assumed that the chair will require replacement every four years until the plaintiff is eighteen.

We would like to thank Stephen Kuyltjes of Rehab Works, Calgary; Sharon Kaczkowski of Kaczkowski Occupational Therapy, Calgary; and Everett Dillman of International Business Planners, El Paso, Texas, all of whom were kind enough to comment on earlier drafts of this article. We are responsible for any remaining errors or omissions.

leaf

Christopher Bruce is the President of Economica and a Professor of Economics at the University of Calgary. He is also the author of Assessment of Personal Injury Damages (Butterworths, 2004).

Kelly Rathje is a consultant with Economica and has a Master of Arts degree (in economics) from the University of Calgary.


Claims by Elderly Parents for Loss of Caregiving by Adult Children

by Hugh P. Finnigan

This article first appeared in the autumn 2005 issue of the Expert Witness.

Advancements in medical technology have prolonged the lives of individuals and dramatically increased their costs of care. As a result, many adult children accept at least some responsibility in the provision of such care to their aging parents. This leads to a possible claim by elderly parents for the loss of caregiving services, if an adult child is seriously injured or killed.

Before such a claim can be made, however, some determination must be made of the probability that an adult child will offer such care, especially if the parent had not been in need of assistance before the child was injured. In this article I shall review some recent American research that examines the factors that determine whether an adult child will care for an elderly parent.

In an early study, Stone, Cafferata, and Sangl (1987) examined 1982 data to develop a profile of caregivers by their relationship to the care recipient. The researchers found that the average age of these caregivers was 57.3. Moreover, one-third of these caregivers were still employed and having to make adjustments to their work schedules. One-third of the caretaker’s families were near or below the poverty line. Finally, one-third of the care providers were themselves in only fair to poor health.

Several researchers have examined opportunity cost as a possible motivation. That is, children might find that the expense of caring for their elderly parents exceeds what they themselves could earn in the workplace. Thus, they might be economically better off to care for their parents in lieu of working a traditional job. Supporting this theory, researchers have found that adult women in particular tend to reduce their hours of paid work (or leave the labour force altogether) to provide care for their parents. This finding is consistent with the persistent wage differentials found between women and men. If women tend to earn less than men, on average, they face a lower opportunity cost when deciding to care for their parents.

It has also been argued that children might feel differently towards their parents, depending on the latter’s marital status. Pezzin and Schone (1999), for example, found that divorced men were less likely to receive care or financial assistance from their children than were divorced women. Moreover, if the divorced father does receive care the number of hours is often lower than that received by mothers or widowed fathers. These findings were later confirmed by Pelkowski (2005).

Pelkowski also found a number of other determinants that had not been measured by other researchers. Most importantly, she found that if the children lived within close proximity (within 10 miles) to their parents there was a far greater chance they would provide care. Also, males with living sisters tended to have a low propensity to provide assistance to their parents. Finally, Polkowski is able to answer a question posed earlier by Folbre and Nelson (2000): in her survey the expectation of a bequest was found not to be an important determinant of a child’s willingness to provide care to an elderly parent.

References

Levit, Katharine R.; Cowen, Cathy A.; Lazenby, Helen C.; McDonnell, Patricia A.; Sensenig, Arthur L.; Stiller, Jean M. and Won, Darlene K. “National Health Spending Trends, 1960-1993.” Health Affairs, Winter 1994, 13(5), pp. 14-31.

Nancy Folbre & Julie A. Nelson, 2000. “For Love or Money-Or Both?,” Journal of Economic Perspectives, American Economic Association, vol. 14(4), pages 123-140.

Pelkowski, Jodi Messer, 2005. “Adult Children’s Propensity to Care for an Elderly Parent: Does the Marital Status of the Parent Matter? The Journal of Economics, 31(1), pp.17-38.

Pezzin, Liliana E. and Schone, Barbara Steinberg. “Parental Marital Disruption and Intergenerational Transfers: An Analysis of Lone Elderly Parents and Their Children.” Demography, August 1999, 36(3), pp. 287-97.

Stone, Robyn I.; Cafferta, Gail L. and Sangl, Judith A. “Caregivers of the Frail Elderly: A National Profile.” The Gerontologist, October 1987, 27(5), pp.616-626.

leaf

From 2003 through 2005, Hugh Finnigan was a consulting economist at Economica, with a Master of Arts degree from the University of Calgary.

Quantifying Soft Tissue Injury in Neck Injured Patients

by Gordon McMorland

This article was originally published in the Winter 2002/03 issue of the Expert Witness.

The ability to obtain objective, reliable functional measurements of the neck allows for extremely effective diagnosis and rehabilitation for chronic neck pain and whiplash-injured patients. The Canadian Whiplash Centre now offers the Hanoun Multicervical Rehabilitation Unit (MCU)
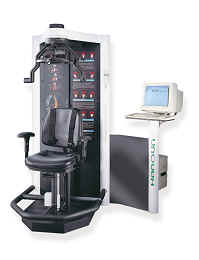
Hanoun Multicervical Rehabilitation Unit (MCU) as an adjunct to traditional forms of assessment and rehabilitation. This leading edge, digital technology provides comprehensive objective and valuable cervical functional diagnostic data. It is used to effectively and objectively assess cervical range of motion and neck strength. Together, these measurements quantify the functional capacity of the neck. This differs from other functional capacity evaluations, in that this technology allows us to specifically measure the functional ability of the injured neck. Once functional deficits have been identified and diagnosed, the system can then be used to efficiently and accurately rehabilitate the injured area(s).

We have never been able to objectively and reliably assess the strength of the supporting neck musculature with as much accuracy as we can with this new technology. The MCU has proven reliability and reproducibility for measuring both neck mobility and, more importantly, neck strength.

Using a sport medicine approach to injuries, we know that regaining muscle strength following injury is a key component to recovery. Quantifying muscle strength guides the decision making in rehabilitation and also acts as an indicator for ability to return to activity. Reduced muscle strength is correlated with reduced functional capacity.

Supported by Research

Recent research out of the Melbourne Whiplash Centre and LaTrobe University in Australia has identified neck muscle weakness, as measured on the MCU, as a common finding in chronic neck-injured (whiplash) patients. This research has quantified the effects of rehabilitating these strength deficits. Correlation has been established between improvements in neck strength and reduction in pain and disability in the chronic neck pain patient.

The research on using this technology to assess cervical functional capacity and then rehabilitate functional deficits are summarized as follows:

Chronic neck pain patients (average duration of injury was 8.3 years) underwent a rehabilitation program on the MCU (average treatment length 6.4 weeks). 76.6% of these patients doubled their neck strength, improved their neck mobility by 25% and reduced their pain and disability by at least 50% over the course of this treatment program. At six month follow up they had maintained approximately 90% of these gains without the need for further treatment.

We think that these superior results have been achieved because we can now objectively assess and prescribe exercise to strengthen the injured area(s) with more accuracy and reliability than ever before. If we follow the sport medicine model of injury management, then it is generally accepted that exercise as a core component to rehabilitation is beneficial. The difficulty lies in gauging the quantity and type of exercise that will be most beneficial and more importantly, not detrimental. Using objective measures form the MCU assessment allows us to judge this more accurately. The MCU also allows us to precisely control the intensity of exercise, the specificity of the exercise to the injured area(s) and the quantity of the exercise.

Graduating the patient from passive treatment modalities into active rehabilitation is now generally considered the gold standard for treatment of whiplash injuries. Our rehabilitation program allows us to objectively quantify (measure) functional deficits such as weakness and reduced range of motion in the cervical spine, and then custom tailor rehabilitation using this cutting edge technology to specifically address the deficit(s) responsible for the patient’s disability.

Medical Legal Application

The cervical functional capacity evaluation can be used to quantify or substantiate damages that have resulted from the injury. Comparison of the patient’s functional ability can be compared to established benchmarks such as that seen in the normal, uninjured population as well as in rehabilitated chronic neck-injured patients. Damages can accurately and reliably be assessed and quantified. Some preliminary work has also been done to correlate the individual’s performance with sincerity of effort. The results of the functional capacity evaluation can then be correlated with the individual’s clinical picture to explain ongoing problems.

As this is quite a new approach to an age-old problem, the patient population that has sought out this treatment has typically been those that have exhausted other, traditional treatment approaches. Even though our results to date are quite encouraging for these chronic patients, we feel there may be more benefit if this treatment can be introduced earlier. Having the ability to quantify the nature and extent of the injury as early as possible will allow for appropriate and effective treatment to be introduced quickly. By re-measuring as the patient progresses through rehabilitation, clinical decisions to either continue, change or discontinue treatment become more objectively supportable. This can help to preventing an individual from entering into a pattern of chronic pain. As a general rule, if the individual is not demonstrating significant improvement and recovery from their injuries at 12 weeks, post injury, then we recommend a functional assessment to diagnose if muscle weakness/atrophy is contributing to the delayed recovery.

We have also had some early success in having section B insurers cover the cost of this rehabilitation. Claims managers and their supervisors have provided very positive feedback about this program. They appreciate the fact that this treatment incorporates objective, reliable and repeatable measurements of the neck’s functional capacity, which allows us to track patient progress as well as identify firm end-points to the rehabilitation.

If you would like more information or have any questions regarding this new technology, or if you feel that our rehabilitation program we offer may be of benefit to your clients, please do not hesitate to contact the director of the Canadian Whiplash Centre, Dr. Gordon McMorland at (403) 270-7237.

leaf

Dr. McMorland is a Calgary-based chiropractor. He is the director of the Canadian Whiplash Centre; and has participated as a researcher in both the faculties of Kinesiology and Medicine at the University of Calgary.

Incorporating the Effect of Reduced Life Expectancy into Awards for Future Costs of Care

by David Strauss, Robert Shavelle, Christopher Pflaum, & Christopher Bruce

This article was originally published in the Winter 2000 issue of the Expert Witness.

1. Introduction

Some of the largest personal injury and medical malpractice actions are brought on behalf of plaintiffs with chronic disabilities such as cerebral palsy, spinal cord injury, and traumatic brain injury. Such plaintiffs require extensive care and assistance for the rest of their lives, and the cost of future care is often the largest part of the claim.

There are three components to the calculation the present value of the cost of lifetime care:

  1. A discount rate, specifying the interest rate at which it is assumed the lump sum award will be invested.
  2. The dollar cost of providing care during each year. The rate at which this amount is assumed to grow over time is usually, though not necessarily, lower than the rate of discount.
  3. A probability distribution specifying the probability that the plaintiff will live to each possible age in the future. In the calculation of the present value of future costs of care, the cost of care in each possible year in the future is multiplied by the probability that the individual will live to the age at which that cost is required. This is equivalent to reducing the required cost by the probability that the plaintiff will not live to a given age and, therefore, that the plaintiff will not require the assumed cost of care. [Note that this is analogous to multiplying the annual loss of income by the probability that the individual would have been working during that year, in order to capture the effect of the probability that the individual would have been unemployed.]

When the injury is not one that reduces life expectancy, the survival distribution that is used is that of the general population. The distribution can be obtained from an ordinary life table. (In Canada, this is the Life Tables 1990-1992.) Our interest here, however, is the case in which life expectancy is reduced, and it is no longer obvious how the annual survival probabilities should be chosen.

2. Alternative methods of calculating the impact of reduced life expectancy

Typically, medical opinion concerning reduced life expectancy is conveyed in the form of an average number of years of expected survival. For example, the medical experts might agree that the effect of the plaintiff’s injury is to reduce her life expectancy from 50 years to 30. The question we wish to consider here is how economists should incorporate this opinion in their calculation of the changes in annual probabilities of survival. A number of alternative techniques are commonly used.

Life certain – A very simple technique is to assume that the plaintiff will live exactly the number of years estimated by the medical experts and then die. For example, a 30 year-old who has a probability of 1.0 of living to each age between 30 and 50, and a probability of zero of living to any age beyond that, has a life expectancy of 20 years.

Although this technique is sometimes used to obtain to obtain very rough approximations, it is certain to produce estimates that exceed the true value by a substantial amount. The reason for this is that the life certain approach leaves all of the costs of care in the immediate future, (in this case, in next 20 years). In reality, the plaintiff has some probability of dying during the next 20 years and a corresponding probability of living more than 20 years. Hence, in reality, the costs of care should be reduced in the near future (to allow for the possibility that the plaintiff will die before needing them) and increased in the distant future (to allow for the possibility that the plaintiff will live beyond 20 years). But, as discounting reduces the present value of ‘distant’ costs more than it reduces the present value of ‘near’ costs, moving costs further into the future will reduce the discounted value of future costs.

Rating up – A simple method for obtaining a probability of survival to each possible age in the future is to find a “statistical person” who has the life expectancy of the injured plaintiff and to use that person’s probability distribution to represent that of the plaintiff. For example, consider a boy with severe cerebral palsy who has an agreed upon life expectancy of 20 additional years. The rating up method identifies the age in the general population at which the life expectancy is likewise 20 years.

According to the U.S. Decennial life tables, for example, this is 58 years. For each future age, the probability of survival for a 58 year old is substituted for that of the 5 year old. For example, the 5 year-old’s probability of living to age 15 is assumed to equal the probability that an average 58 year old would live to 68.

The attraction of this method is that it provides a probability distribution with the correct average, (here, 20 years). There is a problem, however: it is the wrong distribution. As the research literature makes clear, a child with a short life expectancy is subject to a fairly constant risk over the life span; he may well die in the next few years but he also has a reasonable chance of living another fifty. By contrast, the man of age 58 is at a relatively low risk over the next few years, but his risk increases steeply over the decades and he has almost no chance of surviving another 50 years.

Like the life certain method, the rating up method places too many of the costs of care in the immediate future, and too few in the distant future (relative to the “true” values). Hence, it systematically overestimates the present value of future costs of care.

Relative risk – In this approach, the economist multiplies all the age-specific mortality rates in a standard life table by a constant. The constant is chosen to result in the desired life expectancy, and is easily determined by trial and error. For example, if the annual probabilities that a male will die are multiplied by 47, the life expectancy of a 5 year-old will become 20 years. Although the argument is more complex than that made with respect to rating up, the relative risk approach also systematically overestimates the present value of future costs.

3. An Example

Table 1 shows lump sum awards for a 5 year-old boy with life expectancy 20 years who is to receive $100,000 for each remaining year of life. A discount rate of 4 percent is employed.

Table 1

The first row applies to a hypothetical child who will survive exactly 20 more years. This is the life certain distribution discussed above, and it leads to the largest award: $1,413,394. The second row is the result of rating up to age 58, which currently, perhaps, is the most widely used approach. The award of $1,296,174 is appreciably smaller than the $1,413,394 of row 2.

Row 3 uses the relative risk method. As indicated above, when the mortality rates of a standard life table are multiplied by 47, the life expectancy for a boy of age 5 years becomes 20 years. This is the multiplier that has been used. The resulting award of $1,297,290 is very similar to that obtained from rating up. Finally, row 4 gives the award when the correct life table, based on the latest evidence concerning cerebral palsy, is used. Use of the correct probability distribution leads to an award of $1,147,979.

In this example, both rating up and the relative risk method lead to awards that are too high by 13 percent, or approximately $150,000. And the life certain method leads to an award that is too high by almost 25 percent.

4. Comparison of the methods

The size of the discrepancy between the approximate methods and the correct survival distribution depends on several factors, of which the most important are the cost schedule, the discount rate, and the plaintiff’s life expectancy. Discrepancies will tend to increase as the rate of growth of costs decreases, as the discount rate increases, and as post-injury life expectancy falls.

Tables 2 and 3 show the percentage overestimation for various discount rates with the rating up and relative risk methods, respectively. In addition to the case of a five year old with cerebral palsy (Tables 2a and 3a), we also consider that of a 25 year-old with traumatic brain injury and a life expectancy of 20 years (Tables 2b, 3b). As expected, the amount of overestimation decreases as the net discount rate (the discount rate minus the rate of growth of costs of care) decreases, and is negative when the net rate is negative.

Table 2

Table 3

5. Conclusion

To calculate the present value of the lifetime care of a disabled person we need more than a life expectancy – the whole life table is needed. We have seen that rating up and other approximate methods can lead to substantially different present values from the values derived from the correct life table. In the common case of positive net discount rates, the approximate methods systematically overestimate the correct values. These overestimates can often amount to more than $100,000. This is an issue that has received far less attention from the courts than it deserves.

leaf

David Strauss, Ph.D., FASA, and Robert Shavelle, Ph.D., MBA, are the principals in Strauss & Shavelle, a San Francisco firm that specialises in calculation of life expectancy.

Christopher Pflaum, Ph.D., owns Spectrum Economics, an Overland Park, Kansas firm specialising in the calculation of personal injury damages.

Christopher Bruce is the President of Economica and a Professor of Economics at the University of Calgary. He is also the author of Assessment of Personal Injury Damages (Butterworths, 2004).

The Income Tax Gross-Up on a Cost of Care Award

by Derek Aldridge and John Tobin, C.A.

This article first appeared in the winter 1996 issue of the Expert Witness.

Consider a simple example where a plaintiff requires an award to pay for $11,000 in cost of care expenses one year from today. Assuming an annual (nominal, or observed) interest rate of 10 percent, this suggests that an award of $10,000 will be sufficient to cover the future cost of care expenses ($10,000 + 10% x $10,000 = $11,000). But suppose that the plaintiff’s interest income is taxed at a rate of 25 percent. Now $250 of the $1,000 in interest income is lost to tax, effectively reducing the interest rate from 10 percent to an after-tax rate of 7.5 percent (i.e., the plaintiff receives $750 after-tax interest on an investment of $10,000). One year from now the plaintiff will have only $10,750 to cover the $11,000 in expenses, a shortfall of $250.

To compensate for the tax impact, the plaintiff will require an additional award of $232.56 for a total of $10,232.56. Now the plaintiff will earn $1,023.26 in interest income (= $10,232.56 x 10%), of which 25 percent, or $255.82, will be lost to tax, for net after-tax interest income of $767.44. When the net interest income is added to the award, or capital, of $10,232.56, the plaintiff will have the required $11,000 to meet cost of care expenses one year in the future. The additional award of $232.56 is known as the cost of care tax gross-up.

Usually, the gross-up is reported as a percentage of the non-grossed-up award. In the example discussed above the tax gross-up would normally have been reported as 2.3256 percent of the “non-grossed-up” amount $10,000. Readers of The Expert Witness will know from experience that this percentage gross-up varies widely from case to case. The purpose of this article is to identify some of the factors which may affect the percentage gross-up.

Factors affecting the income tax rate (and the tax gross-up)

The gross-up is determined by calculating the plaintiff’s tax liability prior to considering the award for cost of care. This is compared to the liability including income generated from the award for cost of care. The gross-up is the additional capital required to fund the resulting tax liability.

The percentage gross-up is dependent on the plaintiff’s marginal tax rate and the plaintiff’s eligibility for various income tax credits. In the example above, if the individual’s investment income had been taxed at a marginal rate of 50 percent, instead of 25 percent, the effective after-tax interest rate would have fallen from 7.5 to 5 percent. A consequence of the increased marginal tax rate is that now the individual would have to invest $10,476.19 to provide $11,000 one year from today. That is, the percentage gross-up increased from 2.3256 to 4.7619.

A number of factors combine to affect the overall tax rate and the amount of tax paid on income invested to compensate for future costs of care. First, some of the future costs of care may be eligible for a medical tax credit (e.g., the cost of a wheelchair would typically be eligible for a tax credit). A tax credit reduces the plaintiff’s tax liability, at a certain percentage. The more expenses that the plaintiff has which are eligible for a medical tax credit, the lower his tax liability and the tax gross-up. To further complicate the tax calculation, it could be the case that once every five years the plaintiff will incur $50,000 in expenses, of which $40,000 are tax- creditable, while in the other years he faces costs of $20,000, of which only $5,000 are tax-creditable. Also, in certain circumstances the plaintiff’s injury may result in his qualifying for the disability tax credit. This will further reduce his tax burden (and the associated gross-up). In some cases, a severely disabled plaintiff may be entitled to a smaller gross-up, in percentage terms, than a moderately disabled person, as a result of his higher medical expenses and his eligibility for the disability tax credit (though the former’s total cost of care and gross-up will almost certainly be higher).

The plaintiff will usually have other sources of income which will affect the gross-up. Interest income on a loss of income award or a non-pecuniary award, as well as post-accident employment earnings or pension income will all attract tax, and will affect the marginal tax rate on the interest income earned from the cost of care award. (The percentage of tax applied to each dollar of additional income is the marginal tax rate.) The courts have ruled that the investment income from the cost of care award is to be added to all other sources of income and taxed at the rate associated with the highest tax bracket in which the individual’s income places him. To estimate the gross-up, details about the future cost of care requirements (and the associated tax credits) are required as well as information about all of the plaintiff’s expected income, including future employment income and any additional interest income that he will earn (especially from loss of income awards). The higher the plaintiff’s expected income, the greater the percentage gross-up resulting from income being taxed at a higher marginal tax rate.

A third issue to consider is the time path of award consumption. Just as the amount of any non-pecuniary and loss of income award will affect the tax gross-up, the time path of the consumption of these awards will affect the calculation. If the plaintiff spends his entire loss of income and non-pecuniary award immediately upon receipt, then the award will not generate any interest and will not attract any tax. Therefore, the plaintiff will be in a lower marginal tax bracket and he will pay a lower average tax rate over his lifetime on the award for cost of care. This would result in a lower tax gross-up. For the loss of income award, it may be argued that the plaintiff will consume enough of this award each year to compensate him for the income which he has lost due to his injury. For the non-pecuniary award, it may be assumed that the plaintiff will consume the award gradually over his lifetime, or alternatively that he consumes it quite quickly. Except for very large non-pecuniary awards, where the plaintiff does not have any other significant income, the variation of the consumption assumption on the award does not have a significant effect on the gross-up calculation.

We occasionally encounter cases where a plaintiff with a shortened life expectancy is expected to receive a “lost years” award (see “Shortened Life Expectancy: The ‘Lost Years’ Calculation” in the Spring 1996 Expert Witness) – this adds a further complication to the gross-up calculation. In such a “lost years” case, a plaintiff will receive a portion of the money that he would have earned in years in which he is now not expected to be alive. In these circumstances, if we assume that the plaintiff will consume enough of this award each year to compensate him for that year’s loss of income due to his injury, then he will not consume all of the loss of income award before his death. As an alternative in these situations, for the purposes of making the gross-up calculations, we assume that the plaintiff will consume the loss of income award at such a rate that by his expected death he will have consumed the entire award.

Given equal total awards, older plaintiffs will typically require lower gross-ups than their younger counterparts. This is because older plaintiffs will begin to draw on the capital amount earlier, so the interest income will decline more rapidly. A young plaintiff will usually consume only a portion of the interest income (which can be substantial) for several years before he begins to draw on the capital. Thus, we would expect that for several years a younger plaintiff will earn large amounts of (taxable) interest income, in excess of medical expenses which may be eligible for a tax credit. It should be noted, however, that if the plaintiff is a child then he may not be required to pay tax on any of the interest income earned on the cost of care award until the tax year of his 21st birthday. This would substantially reduce the tax gross-up. If a minor has a shortened life expectancy then it is conceivable that the gross-up would be nominal.

In the example described at the beginning of this article, it was assumed that the cost of care would be incurred one year hence. It can easily be shown that the tax gross-up will be larger, the further into the future is the cost of care to be incurred. For example, assume that $16,105.10 is to be replaced 5 years from now and that, again, the interest rate is 10 percent. In the absence of taxes on the investment income, this amount can be replaced with an investment today of $10,000. If the interest income is taxed at a marginal rate of 25 percent (resulting in an effective after-tax interest rate of 7.5 percent), the required award will increase to $11,218.15 – for a tax gross-up of 12.1815 percent (compared to 2.3256 percent in the earlier example). As the number of years over which the award is to be invested increases, the interest which will be earned on the award also increases. Hence, while the non-grossed-up award (here, $10,000) remains the same, the impact of income taxes increases, as does the percentage gross-up. In short, the longer is the period over which the costs of care are to be awarded, the higher is the percentage gross-up (everything else being equal).

Summary

To summarize, we have listed some of the factors which influence the value of the gross-up. Other things being equal, we can normally assume the following:

  • Cost of care award. A larger cost of care award will generate more interest and more tax. Thus it will lead to a higher gross-up.
  • Loss of income award. A larger loss of income award will translate to a larger cost of care tax gross-up.
  • Post accident employment income. Greater post accident employment earnings will lead to a larger gross-up.
  • Tax-creditable expenses. The greater the portion of tax-creditable expenses, the less tax will be paid. Thus the tax gross-up will be lower.
  • Time path of consumption. If a large portion of the cost of care award will be consumed early in the plaintiff’s life, then this will lead to a lower gross-up.
  • Age. Young plaintiffs will generally require larger gross-ups than will old plaintiffs, both because they will have more interest income and, therefore, be in higher tax brackets, and because their awards will continue much further into the future.

leaf

Derek Aldridge is a consultant with Economica and has a Master of Arts degree (in economics) from the University of Victoria.

John Tobin, CA, is a partner with Kenway Mack Slusarchuk Stewart LLP Chartered Accountants.