This article first appeared in the winter 2008 issue of the Expert Witness.
Introduction
In February, 2008, Economica Ltd. was retained by the Canadian Bar Association to prepare a series of reports on automobile insurance premiums in five provinces: Alberta, Ontario, New Brunswick, Prince Edward Island, and Nova Scotia. We have now completed this work, having prepared two reports on Alberta and one on each of the other four provinces.
In this article, we summarise the main findings of the first of these reports, Alberta’s Minor Injury Regulation: Automobile Insurance Profits, Premium Rates, and Costs, prepared by Christopher Bruce, of Economica, and Jason Strauss, a Ph.D. student in the department of Risk Management and Insurance at Georgia State University. (The full text of this report can be found at: www.cba-alberta.org)
Our Report had three purposes:
- to provide a measure of the profitability of automobile insurance in Alberta in the period 1996-2006, (that is, immediately preceding and immediately following the introduction of Alberta’s Minor Injury Regulation, the MIR, in the Fall of 2004);
- to determine whether the observed changes in profits and premiums in the years prior to the introduction of the MIR had been caused by changes in costs; and
- to identify what the effects on profits and premiums would be if the MIR was removed.
We summarise the results of our analyses in the three following sections of this article.
1. Profitability of Basic Coverage
As the MIR applied primarily to Basic Coverage, we focus in this section on that line of insurance. The methodology we use to estimate profits is based on the approach developed by the Insurance Bureau’s actuary, Mr. Joe Cheng, for his testimony in the case of Morrow v. Zhang (2008). (It was in Morrow that the constitutionality of Alberta’s Minor Injury Regulation was challenged.)
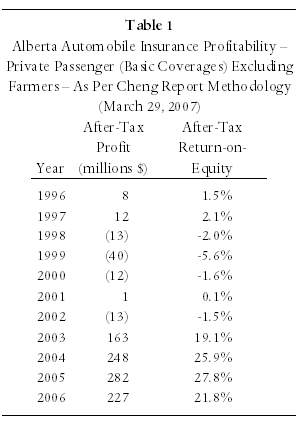
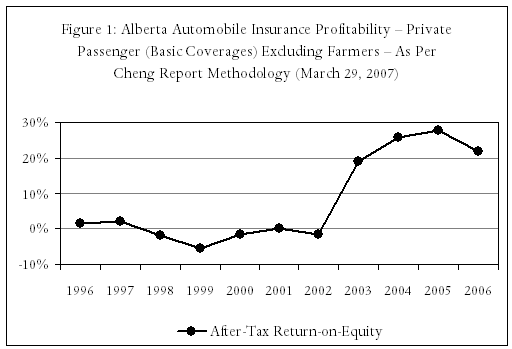
The most common measure of industry profitability (and the measure used in the Cheng Report), is after-tax “return on equity” (ROE) – that is, the industry’s after-tax profits divided by the value of the investments made in the industry. In Table 1 and Figure 1 (taken from our Report), we show that, prior to 2003, Basic Coverage was not profitable in Alberta, with an ROE ranging from -5.6 to +2.1 percent. In 2003, however, the return on Basic Coverage increased dramatically, to 19.1 percent, and rose above 20 percent in each of 2004, 2005, and 2006.
1.1 Claims costs relative to total costs
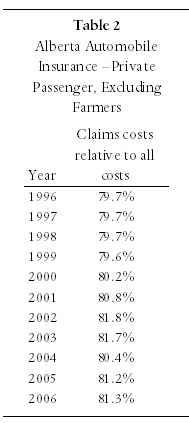
It is possible that the sudden increase in ROE in 2003 could have arisen from a dramatic change in the costs of claims. The data in Table 2, however, indicate that these costs remained a relatively constant portion of insurance companies’ total costs throughout the entire period 1996 to 2006. That is, the rate at which the costs of claims were rising was not appreciably different from the rate at which insurance companies’ other costs – primarily the costs of administration – were increasing.
1.2 Claims costs relative to premiums
Alternatively, profits may have risen in the 2003/2004 period because claims costs fell relative to premiums. We investigate this possibility in Table 3, which reports changes in claims costs per motorist, relative to average premiums. What this table indicates is that, until 2002, premiums tracked claims costs fairly closely. That is, each increase in claims costs per motorist was matched by a similar increase in insurance premiums, resulting in a ratio of costs to premiums that varied only slightly. For example, while the average claim for Basic Coverage was 99.0 percent of the average premium in 1996, that ratio was 92.9 percent in 2002 – because premiums rose by 39.1 percent over that period, while average claims rose by a similar amount, 30.3 percent.
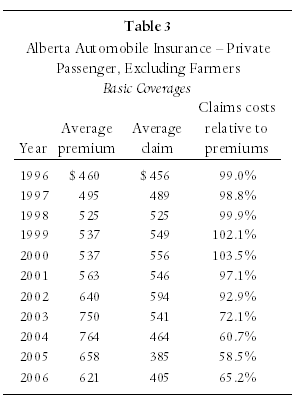
In 2003 and 2004, however, premiums rose much more quickly than did claims costs, driving down the claims ratio. Between 2002 and 2004, for example, the average premium rose by 19.3 percent, while average claims actually fell by 21.9 percent. Thus, it appears that the dramatic increase in profit rates over the 2003-2004 period was driven, in large part, by a sudden change in the relationship between the costs of Basic Coverage and the premiums that were charged for that coverage. In the following section, we investigate a number of factors that might have led to this change.
2. Changes in Costs per Vehicle
The price of automobile insurance – the premium – is affected by four components. First, there are the average costs of claims (including adjustment expenses) per vehicle that were discussed in the preceding section. Second, allowance must be made for administration expenses (broker’s commissions, overhead, etc.). Third, insurers earn income from the investment of equity and reserves (premium revenue that will eventually be used to pay claims). Finally, a reasonable rate of profit must be added to net costs.
The question we address in this section is whether the increases in premiums between 1996 and 2004 can be attributed to changes in any of these components.
2.1 Average claims per vehicle
In Table 3, we showed that the cost of claims rose at approximately the same rate as the price of premiums over the period 1996 to 2002. Thus, if there was a need for increased premiums in 2003 and 2004, it was not because the ratio of claims costs to premiums had changed over the preceding six years.
Nevertheless, Basic Coverage is composed of a number of sub-categories, including Third-Party-Liability and Accident Benefits. In turn, Third-Party-Liability (TPL) is composed of TPL-Property Damage and TPL-Bodily Injury, of which only the latter was affected by the Minor Injury Regulation (MIR). Thus, it is possible that even though claims costs for Basic Coverage as a whole did not increase in 2003 and 2004, there may yet have been an increase in the component that was affected by the MIR. To investigate this possibility, we report the data in Table 4.
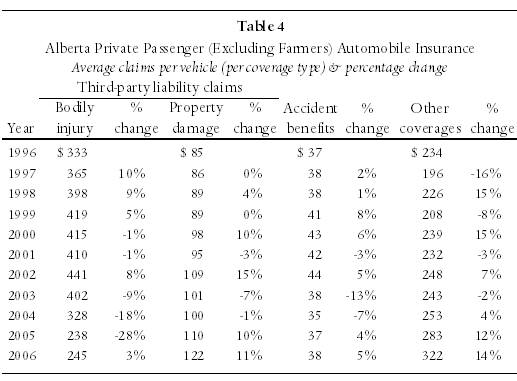
In this Table, it is seen that the claims for TPL-Bodily Injury increased at roughly the same rate as the other components of Basic Coverage prior to the MIR. For example, whereas claims for Bodily Injury increased by 32.5 percent between 1996 and 2002, claims for Property Damage increased by a similar percentage, 27.8.
We are led to ask, therefore, whether a change in some other element of the cost of insurance can explain the sudden increase in premiums that was observed in 2003 and 2004. In sections 2.2, 2.3, and 2.4 we analyze administrative expenses, investment income, and return on equity.
2.2 Administrative expenses
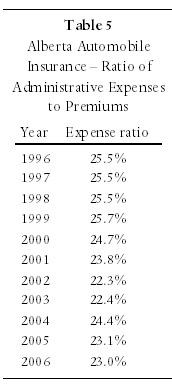
Table 5 reports that the ratio of administrative expenses to premiums (the expense ratio) decreased from 25.5 percent in 1996 to 23.8 percent in 2001. As average premiums increased only slightly over this period, the dollar value of expenses must have been decreasing or relatively stable. Furthermore, in the time period immediately prior to the introduction of the Minor Injury Regulation, 2002 and 2003, expense ratios fell further while premiums increased dramatically. It can be concluded, therefore, that changes in administrative expenses were not the source of the premium increases that occurred in 2002 and 2003.
2.3 Return on investment
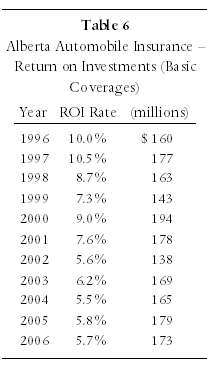
Insurance premiums are placed in a reserve until claims have to be paid. Those reserves are invested and the investment income generated thereby is credited against the cost of premiums. Hence, an increase (reduction) in the rate of return on investment, ROI, may lead to a decrease (increase) in premiums.
It is seen in Table 6 that the ROI insurers earned on their equity and reserves declined almost continuously over the period 1996 to 2001. Nevertheless, this decrease placed only limited upward pressure on premium rates. Specifically, we estimate that to compensate for the decrease in ROI from 9.0 percent in 2000 to 6.2 percent in 2003, insurers would have needed a $44 increase in the 2003 premiums on Basic Coverage. In fact, those premiums increased by $213, from $537 to $750. (See Table 3.) This confirms that decreasing ROI was not the primary impetus for the premium increases in 2002 and 2003.
2.4 Return on equity
Once the net costs of insurance have been calculated, the premium is determined by adding a profit margin, or return on equity, ROE, to those costs. Thus, as the necessary ROE increases, premiums will also increase. We surveyed seven sources of expert opinion concerning the appropriate ROE target for the automobile insurance industry. We found:
- Dr. Norma Nielson and Dr. Mary Kelly, in a presentation to the Alberta AIRB October 20, 2006, recommended an ROE in the range of 14.31 to 18.26 percent
- NERA Consulting Economists, in a report for the Newfoundland & Labrador Board of Public Utilities, October 13, 2004, recommended an ROE in the range of 11 to 14 percent.
- Based on NERA’s report, Dr. Ronald R. Miller of Exactor Insurance Services Inc. recommended an ROE of 12.5 percent.
- Dr. Basil A. Kalymon, on behalf of the consumer advocate, recommended to the Newfoundland & Labrador Board of Public Utilities that the target return on equity for the setting of automobile insurance rates should be 9 to 10 percent.
- The consumer representative to the Alberta AIRB, Ms. Merle Taylor, CMA, recommended that the ROE be higher than the allowable rate for utilities (at that time, 8.9 percent). She also stated that a 19.6 percent ROE would be “excessive.”
- In his testimony in Morrow v. Zhang (2008), actuary Joe S. Cheng, F.C.I.A. stated that a 12.5% ROE was considered by many insurers to be in the low end of a reasonable range; and that the high end of a reasonable range might be 20%.
The Alberta Automobile Insurance Rate Board (AIRB) currently employs a formula that implies that an after-tax ROE of 9.5 percent would be appropriate.
Excluding the report by Merle Taylor, which did not give an exact range or recommendation, the average of the six remaining experts’ opinions concerning a reasonable ROE for automobile insurance is 12.76 percent. This figure is well above the rates earned on Basic Coverage in Alberta between 1996 and 2002, (see Table 1), but is well below the rates earned since then. Most importantly, Alberta insurance companies earned an ROE of 19.1 percent in 2003, the year before the introduction of the MIR.
2.5 Summary and conclusions
- As indicated in the preceding sections, claims did not dramatically increase in the time period leading up to the Minor Injury Regulation.
- As also shown above, administrative expenses did not increase but, rather, decreased in the time leading up to the Minor Injury Regulation.
- Although investment returns decreased in the time leading up to the Minor Injury Regulation, their effect on the increase in premiums was minor.
- ROE for Basic Coverage averaged -1 percent per year in the period 1996 to 2002 (7.4 percent for All Coverages). During this same period, average premiums for Basic Coverage only increased by 6 percent per year on average (4.5 percent per year on average for All Coverages). This premium deficiency (the difference between premium charged and premium required to reach a reasonable rate of return) appears to have been the primary impetus for the sharp increase in premiums that occurred in 2002/2003, as the “soft” market ended and a “hard” market began.
- We estimate that without the premium increases in 2002 and 2003, ROE on Basic Coverage would have been -3.8 percent (in 2003).
3. Projected Effect of Removing the Minor Injury Regulation
Using the AIRB’s methodology, and controlling for other reforms beside the Minor Injury Regulation (i.e. controlling for the gross to net income reform and the collateral income reform), we estimate that the required average premium increase for Basic Coverage, if the Minor Injury Regulation had been removed, would have been $111.76/year if industry profits were to be maintained at their 2006 level, of 21.8 percent.
Alternatively, using the AIRB’s methodology, we estimate that insurer ROE for Basic Coverage would have been 12.2 percent in 2006 if the Minor Injury Regulation had been removed and premiums held constant. (Furthermore, in this case, the ROE would have been 16 percent for All Coverages.)
![]()