Spring 2007 issue of the Expert Witness newsletter (volume 12, issue 1)

Contents:

Using the HALS/PALS data sets to estimate a loss of income

by Derek Aldridge

This article first appeared in the spring 2007 issue of the Expert Witness.

Many of our readers will have heard of Statistics Canada’s “HALS” and “PALS” disability statistics. These result from surveys that collected data concerning Canadians with disabilities and the manner in which their everyday lives are affected by these disabilities. The HALS statistics are from Statistics Canada’s 1991 Health and Activity Limitation Survey and the PALS statistics are from the 2001 Participation and Activity Limitation Survey.

Of particular interest to our readers is how these statistics can be used to predict the economic impact that a particular disability will have on a specific plaintiff. I have been asked numerous times by plaintiff’s lawyers if it is possible to use the HALS statistics to help determine their client’s loss. In addition, I have been asked by defence lawyers to rebut the claims of other economists who have used this approach. In this article I will discuss the difficulty of using the HALS/PALS approach to estimate a plaintiff’s loss of income. Before offering my comments concerning these statistics, I will provide some background information on the data sets.

In the 1991 and 2001 censuses, recipients of the long-form census forms were asked a few questions designed to determine whether or not they were disabled in a way that limited their activities at home, at work, or at school. Some of those who indicated a disability were subsequently interviewed for a detailed disability survey (a “post-censal” survey). Following the 1991 census, approximately 35,000 adults from the “disabled” census group were selected for the detailed HALS survey. (For technical reasons that do not need to be discussed here, a larger number from the “non-disabled” census group were also selected for the follow-up survey.) Following the 2001 census, approximately 35,000 adults and 8,000 children from the “disabled” census group were selected for the detailed PALS survey.

The 1991 HALS survey identified six types of activity limitation among the adults surveyed: hearing, seeing, speech, mobility, agility, and other (a grouping of non-physical disabilities related to psychological conditions, learning, memory, and so forth). The 2001 PALS survey identified ten types of limitation: hearing, seeing, speech, mobility, agility, learning, developmental disability or disorder, psychological, memory limitation, and chronic pain. Individuals were asked questions to determine the degree of their disability and based on the answers to these questions, their level of disability was assigned a severity scale. In 1991 there were three severity levels: mild, moderate, and severe. In 2001 the severity levels (except for children under five) were mild, moderate, severe, and very severe. The classification examples below are from the Statistics Canada Publication A Profile of Disability in Canada, 2001 (Catalogue 89-577-XIE):

For example, a person who has no difficulty walking and
climbing stairs but cannot stand in line for more than 20
minutes, would have a mild mobility-related disability. A
person who can only move around in a wheelchair would have
their mobility more severely limited, and one who is
bedridden for a long term period would have a very severe
mobility-related disability. The number of disabilities also
has an impact on the overall level of severity. The PALS
distinguishes 10 types of disabilities among adults and the
level of severity will increase with the number of
disabilities affecting each individual. [Pages
19-20]

In addition to questioning individuals about their limitations, PALS also asked about the cause of disability (e.g., a motor vehicle accident), the age at which the activity limitations began, the level of education, the number of hours worked per week, the reason for working fewer than 30 hours per week, the person’s occupation and industry, the rate of pay, the amount of unemployment experienced in the past year, and numerous other questions. The PALS questionnaire and reporting guide is 86 pages long.

As a result of these surveys, there is a wealth of information available concerning people with disabilities in Canada. Some examples follow, again taken from the publication A Profile of Disability in Canada, 2001:

  • Mobility problems are the type of disability most often
    reported by adults aged 15 and over. In 2001, nearly 2.5
    million or 10.5 percent of Canadians had difficulty walking,
    climbing stairs, carrying an object for a short distance,
    standing in line for 20 minutes or moving about from one room
    to another.
  • More than 10 percent of adults have activity limitations
    related to pain or discomfort.
  • The prevalence of most types of disabilities increases
    with age.
  • A large majority of persons with disabilities aged 15 and
    over have more than one disability.
  • Nearly 6 percent of Canadians aged 15 and over have a
    severe or very severe disability.
  • 7.5 percent of all working-age persons are limited in
    their activities due to pain or discomfort.

This is all very interesting, and surely the survey results have many useful applications. However, for our purposes, we want to know how these surveys can be used to help estimate a specific person’s loss of income as a result of an injury. A statistical (econometric) analysis of the data could tell us (for example) how the annual income of an average “severely disabled” male differs from that of males overall. Even better, we might be able to compare the incomes of male journeyman welders age 30-40 who are experiencing severe pain and agility disabilities, with the corresponding average for those who are not disabled. (Or with the corresponding overall average that includes mostly people who are not disabled, and some who are.) Note however, that we have a problem in that as we get more and more specific with respect the category of disabled people, we have less and less confidence in the accuracy of the reported averages. This is because as we get more specific, our sample size gets smaller and smaller and the characteristics of the sample become heavily influenced by the characteristics of a few individuals. I think we could be reasonably confident in our claims about the earnings of severely disabled males relative to males overall, but not very confident at all about my hypothetical welders.

For now let us ignore the technical problems that might arise, and suppose that we are able to construct a statistical model with the HALS data and use it to estimate with confidence, the average earnings of full-time employed severely disabled males aged 30-40 with high school diplomas. Suppose we find that they earn 25 percent less than the overall average for full-time employed males aged 30-40 with high school diplomas. How can we use this information when we come upon a 35-year-old plaintiff who is a high school graduate and has residual deficits that can be categorised as severe? Suppose the plaintiff is working as a full-time truck driver, and we determine that he is earning about 25 percent less than the average for truck drivers his age (consistent with the HALS prediction). Perhaps we can now conclude that the HALS approach does a fine job of predicting his loss of income, assume that the 25 percent loss will continue until retirement, calculate the present value, and move on to the next case.

This conclusion might be reasonable, but what if it is found that the plaintiff can improve his income by retraining and changing occupations? What if it is found that his condition will improve (or worsen) in the future? What if we find that he was already earning a below-average income before he was injured? My point here is that while it is useful to consider the average impact of disability, it is more important to examine the specific plaintiff at hand and investigate how his injuries are affecting his employability and his income. With respect to these issues, the advice of a vocational expert can often be especially helpful.

It is important to recognise the meaning of my (hypothetical) 25 percent reduction estimate, and its limitations. I proposed that the evidence might support a conclusion that full-time employed severely disabled 30-40 year-old males with high school diplomas earn 25 percent less than their non-disabled counterparts on average. In other words, if we randomly selected from the population a person in this category, we would predict that his income will be 25 percent less than the average for his non-disabled counterparts. However, once we can more closely examine the randomly chosen person, we learn more information about him and we may need to revise our prediction.

For example, suppose he has a severe mobility disability but he is also a professional writer. In this case we might have to revise our prediction since his earnings as a writer are probably only slightly affected by his poor mobility. What if we learned that he had been a professional hockey player but had to leave that occupation and is now working in sales? In this case we would also revise our prediction since his earnings reduction is likely much more than 25 percent. It should be clear that as soon as we are considering a particular individual, and not some unknown “randomly selected” person, we need to try to incorporate the additional information we have about that person, and if our HALS estimates are no longer sensible, they should be discarded. This principle is the same as would apply if we wanted to predict the income of a full-time 45-year-old female teacher who is at the top of the salary grid with the Calgary Board of Education. It would be foolish to rely on census data for female teachers instead of simply consulting the appropriate salary grid.

In most cases, it is not even necessary to concern ourselves with the predictions of a HALS model. If a plaintiff was a well-established welder and now he is unemployable due to an injury, HALS adds nothing to the estimate of his economic loss. However, suppose we have an individual whose disabilities are categorised as severe, but he continues to work in his pre-accident job and is not currently experiencing a loss of income. Might this be an occasion when the HALS approach is especially useful in estimating his loss of income, due to the uncertainty regarding how his injuries will affect his future earnings? Probably not. To begin with, the fact that the plaintiff is not currently experiencing a loss of income suggests that he is unlike the average HALS individual. It is an awkward but unavoidable fact that a statistical model will not do a good job of predicting outcomes for “outliers”. That is, if we create a predictive statistical model using a certain sample group, the model’s predictive power diminishes if the subject under consideration is very much unlike the average member of the sample group. But let us ignore this problem for now.

Perhaps we could assume that, in the future he will be more like the average and will experience that 25 percent loss, on average over the remainder of his work-life. This immediately leads to a logical problem that should give plaintiff lawyers pause before relying on such an assumption. If one wants to argue that a plaintiff who is not now experiencing a loss of income will become just like the HALS average in the future, then what of the plaintiff who is now experiencing a loss of income greater than the predicted 25 percent? The reasoning above suggests we should assume that his earnings will improve to only a 25 percent loss, on average, over the remainder of his work-life. This reasoning is, of course, faulty. When we observe a person experiencing less than the expected income reduction, the reasonable conclusion is that he is one of the individuals whose disability has a relatively mild effect on his earnings. The conclusion is not that his earnings gap will widen in the future, as this effectively ignores the additional information conveyed by the his current income. Parallel reasoning applies when we have a person experiencing a greater than expected income reduction.

To be clear, it could be the case that the working plaintiff who is not currently experiencing a loss of income will indeed experience one in the future. However, I do not believe that the loss will be supportable using HALS alone. In such a case, the HALS data would tell us that the individual is currently performing better than his disabled peers (on average), but we still need more evidence to find that he will have a future loss. That evidence may be available from medical experts, vocational experts, or the plaintiff’s employer. Perhaps there is evidence that the plaintiff faces a greater chance of future unemployment, or is likely to retire early due to his residual deficits. These factors will lead to a loss of income and they can be explicitly incorporated in our calculations – there is no need to appeal to HALS averages. Alternatively, it may be the case that the plaintiff is not now experiencing a loss of income because the injuries are not affecting his ability to earn income and never will. In that case we might be left with a “loss of capacity” argument, which I will not address here.

To summarise, I believe that in most cases when we have an adult plaintiff, the HALS approach is not going to be especially useful in determining his loss of income. It simply provides a useful baseline to compare a particular plaintiff to his disabled peers, in the same way that census income averages tell us how a particular 45-year-old female teacher’s earnings compare to her same-age peers.

There are cases in which I think the HALS approach could be useful, and these are when we know very little about how a disability will affect a person’s employment and earnings. For example, in the case of a child who is injured, we could use HALS to predict the impact on her future earnings. Even in such circumstances, the HALS approach would still be limited in at least two ways. First, the HALS approach will only be valid if the child’s expected educational attainment is unaffected by the injuries. Second, in such a case we would also need a HALS model that can be restricted to those adults who were injured when they were children, since there will certainly be a difference in the impact of (say) a severe mobility disability on earnings if the person is injured at age 10 versus if she is injured at age 40. This restriction will add to the sample size problems I noted above. For an injured adult the HALS approach could be useful if there remains a great deal of uncertainty regarding how her earnings will be affected. For example, in the case of a plaintiff who has been out of the labour force for many years (due to parenting responsibilities perhaps) and who has not yet attempted to re-enter the labour force.

In these cases however, like all others, we must remain willing to discard the HALS averages if we have better information about how the plaintiff’s income will be affected. It is not satisfactory to say that because the loss of income is difficult to determine, HALS will yield our best estimate. In most cases we can do better, because we are not predicting the income of a randomly selected disabled individual. Instead we are predicting the income (and loss) of a specific individual about whom we know a great deal. The fact that we have a HALS model at our disposal does not mean that we should ignore the facts of our specific plaintiff.

leaf

Derek Aldridge is a consultant with Economica and has a Master of Arts degree (in economics) from the University of Victoria.

Forecasting the long-term interest rate on Government of Canada bonds: “market-based” versus “conservative” investment

by Christopher Bruce

This article first appeared in the spring 2007 issue of the Expert Witness.

Introduction

In order to calculate the lump-sum, or discounted, value of a future stream of earnings, the financial expert must forecast the rate of interest (or discount rate) at which the plaintiff’s damages will be invested. Although most experts now base this forecast, to a large extent, on the rates of interest available on Government of Canada bonds, disputes have arisen concerning the manner in which the data concerning these bonds should be interpreted.

Fundamentally, the question comes down to one of whether the plaintiff can be assumed to take a “conservative” approach, in which she invests her damages in long-term bonds and holds those bonds to maturity; or whether she can be assumed to follow a “market-based” (or “speculative”) approach in which she buys and sells bonds as market conditions change.

Whereas Economica favours what I have called the conservative approach, some other economists employ the market-based approach. In this article, I first describe how interest rates are determined under each of these approaches and then I explain why I believe that the market-based approach is inappropriate.

Definitions

Imagine the following scenario: the court has ruled (i) that one component of the plaintiff’s damages is a loss of $50,000 twenty years from now; and (ii) that the interest rate to be used to discount this loss is five percent. In this case, the lump sum value of the loss can be determined to be $18,844 (= $50,000/1.0520).

It is possible that the court could have obtained its interest rate assumption simply by observing the rates offered on twenty-year bonds – what I will call the “posted” rates. Implicitly, in that case, it would have been assuming that the plaintiff will use his damages to purchase a twenty-year bond (or similar, long-term financial instrument) that pays five percent per annum; and that he will hold that bond until maturity. I call this the “conservative” approach.

Alternatively, however, the court might have assumed that the plaintiff will not hold his bond until maturity, but will buy and sell bonds as interest rates vary. In this approach, the effective interest rate will be the average of the rates that the plaintiff can expect to earn over the twenty year period. I call this approach the “market-based investment” approach.

Market-based investment in bonds operates in the following way: Imagine that, at a time when posted interest rates are five percent, the plaintiff has paid $18,844 to purchase a twenty-year bond worth $50,000 on maturity. Assume also that, one year later, interest rates have fallen to four percent. At that rate, it would cost $23,732 (= $50,000/1.0419) to purchase a bond that paid $50,000 nineteen years in the future. The plaintiff could now sell his twenty-year bond, (which, after a year, has nineteen years left on it), for this amount – making a profit of $4,888 (= $23,732 – $18,844), or an effective rate of return of 25.94 percent, in one year.

Rates such as this can be earned on long-term bonds as long as the interest rates on those bonds are falling. For example, a bond that pays $10,000 ten years from now will cost $5,584 when interest rates are six percent; and a bond that pays $10,000 nine years from now will cost $6,446 when interest rates are five percent. Thus, the investor who purchases a ten-year bond at six percent will be able to sell it one year from now for a profit of $862 (= $6,446 – $5,584), or an effective return of 15.44 percent (= $862/$5,584), if interest rates fall to five percent.

Whenever interest rates are falling, the investor who actively trades long-term bonds will make effective rates of return that exceed the rates that would be obtained if those bonds were held to maturity.

Conversely, however, if interest rates are rising, the market-based trader will earn effective rates that are lower than the posted rates. For example, if the interest rate is seven percent, a bond that pays $10,000 nine years from now will cost $5,439 (= $10,000/1.079). It was seen above, however, that a bond that pays $10,000 ten years in the future will cost $5,584 when interest rates are six percent. Thus, an investor who purchases a ten-year bond at six percent will lose $145 (= $5,439 – $5,584), for an effective “return” of -2.6 percent, if interest rates fall to seven percent and he sells it one year later.

What is less clear from these examples is that, if the effective interest rates are averaged over a long period of time, they will equal the rates that investors would have obtained had they held their bonds to maturity. Over the long-run, the investor who sells multi-year bonds after one year, and replaces them each time with other multi-year bonds, will average the same rate of return as an investor who buys and holds bonds to maturity.

Data

Table 1 reports both the posted and the effective rates of interest on Government of Canada bonds of 10+ years to maturity, for the last 25 years. It is seen in the first column of this table that posted interest rates have fallen almost continuously over the entire period: from 15.22 percent in 1981 to 4.39 percent in 2005.
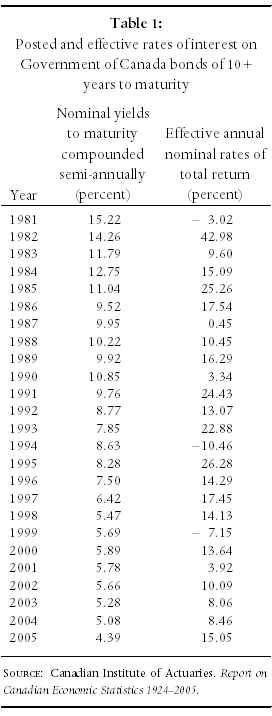
Table 1

Given the discussion above, therefore, we expect to see that effective interest rates over most of this period would exceed the posted rates. It is seen in the second column of Table 1 that this is what happened. Particularly noticeable is the effective rate in 2005: 15.05 percent at a time when posted rates were in the four to five percent range.

As those who argue for the use of effective rates anticipate that the average of those rates will equal the average of the posted rates over the long run, Table 2 reports average posted and effective rates, both in nominal and “real” terms, for various sub-periods in the last 50 years.
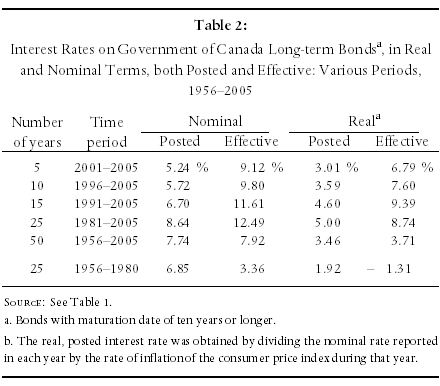
Table 2

It is seen there that, whether nominal or real (i.e. net of inflation) rates are used, effective rates have exceeded posted rates in every sub-period in the last 25 years. For example, whereas the average effective nominal rate was 12.49 percent between 1981 and 2005, the average posted rate was 8.64 percent. The comparable real rates were 8.74 and 5.00 percent, respectively, a difference of over three percentage points in each case.

Only if a fifty year period is used do the effective and posted rates begin to approach one another – primarily because the 25 year period from 1956 to 1980 experienced extremely low effective rates of return (hence balancing the high rates from 1981-2005 in the calculation of the fifty-year average).

Drawbacks to Use of the Effective Rate

A review of the information contained in Tables 1 and 2 makes it clear that there are many disadvantages to the use of the effective rate as an indicator of the rate of return that plaintiffs will be able to obtain in the future.

1. The most serious difficulty with this rate is that it has been extremely variable. As a result, one can obtain almost any estimate of the real effective rate that one wishes, simply by choosing the appropriate time period.

Those who wish to argue for a very high rate might choose the fifteen-year period 1991-2005, with an average rate of 9.39 percent, for example. Whereas those who wish to argue for a much lower rate could choose the fifty-year period 1956-2005, with an average rate of 3.71 percent – or even the 60-year period 1946-2005, with an average of 2.44 percent.

There is no sound reason for choosing any one of these periods over the other. For example, it would be difficult to justify averaging together the 1956-1980 average, of -1.31 percent, with the 1981-2005 average, of 8.74 percent, to obtain a forecast of the rate of return obtainable over the next ten years.

2. A related problem is that the extreme variability of the effective rate virtually guarantees that the rate of return the investor will actually earn will differ significantly from the average rate obtainable over the long run. Hence, it would never be prudent to advise plaintiffs to adopt the market-based investment approach on which the effective rate is based.

3. Because long-term interest rates have been falling for 25 years, they have reached levels so low that most analysts believe they will not fall further – they certainly cannot fall by more than ten percentage points, as they did between 1981 (15.22 percent) and 2005 (4.39 percent). This means that the very high effective rates that have been observed in the last 25 years will not be observed again. Indeed, it is highly likely that nominal rates will rise over the near future, causing effective rates to fall, perhaps even into negative figures. As a result, plaintiffs would not be well-advised to engage in market-based investment in bonds.

4. Even if effective rates are positive, and above posted rates, the effective rate is not an appropriate rate for determining long-term rates of return on investments.

Return to the example developed in the first section of this article: The court has found that the plaintiff will lose $50,000 twenty years from now. Hence, if the interest rate is five percent, the lump-sum value of the plaintiff’s damages amount to $18,844. If, between now and one year from now, the interest rate falls to four percent, the plaintiff will be able to sell his bond for $23,732, earning a one-year rate of return of 25.94 percent.

But the plaintiff still needs to set aside enough money to replace his future $50,000 loss. At the new four percent interest rate, this will cost him $23,732. The money he has “earned” by selling his bond now has to be spent to replace it. Thus, the high effective rate of interest is illusory.

leaf

Christopher Bruce is the President of Economica and a Professor of Economics at the University of Calgary. He is also the author of Assessment of Personal Injury Damages (Butterworths, 2004).